

India: Effects of Tariffs and Nontariff Measures on U.S. ... - USITC
India: Effects of Tariffs and Nontariff Measures on U.S. ... - USITC
India: Effects of Tariffs and Nontariff Measures on U.S. ... - USITC

You also want an ePaper? Increase the reach of your titles
YUMPU automatically turns print PDFs into web optimized ePapers that Google loves.
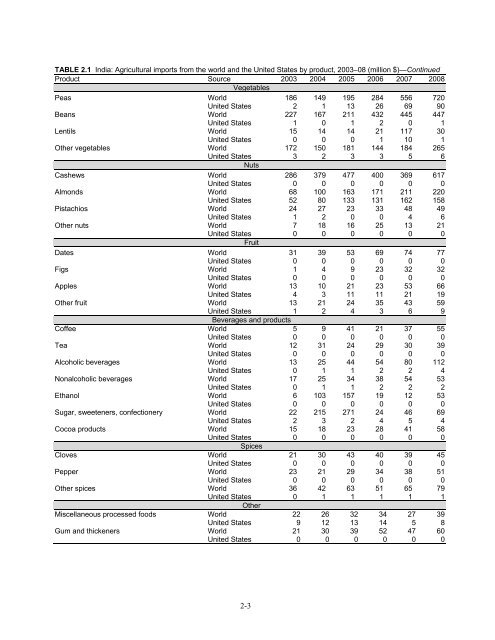
TABLE 2.1 <str<strong>on</strong>g>India</str<strong>on</strong>g>: Agricultural imports from the world <str<strong>on</strong>g>and</str<strong>on</strong>g> the United States by product, 2003–08 (milli<strong>on</strong> $)—C<strong>on</strong>tinued<br />
Product Source 2003 2004 2005 2006 2007 2008<br />
Vegetables<br />
Peas World 186 149 195 284 556 720<br />
United States 2 1 13 26 69 90<br />
Beans World 227 167 211 432 445 447<br />
United States 1 0 1 2 0 1<br />
Lentils World 15 14 14 21 117 30<br />
United States 0 0 0 1 10 1<br />
Other vegetables World 172 150 181 144 184 265<br />
United States 3 2 3 3 5 6<br />
Nuts<br />
Cashews World 286 379 477 400 369 617<br />
United States 0 0 0 0 0 0<br />
Alm<strong>on</strong>ds World 68 100 163 171 211 220<br />
United States 52 80 133 131 162 158<br />
Pistachios World 24 27 23 33 48 49<br />
United States 1 2 0 0 4 6<br />
Other nuts World 7 18 16 25 13 21<br />
United States 0 0 0 0 0 0<br />
Fruit<br />
Dates World 31 39 53 69 74 77<br />
United States 0 0 0 0 0 0<br />
Figs World 1 4 9 23 32 32<br />
United States 0 0 0 0 0 0<br />
Apples World 13 10 21 23 53 66<br />
United States 4 3 11 11 21 19<br />
Other fruit World 13 21 24 35 43 59<br />
United States 1 2 4 3 6 9<br />
Beverages <str<strong>on</strong>g>and</str<strong>on</strong>g> products<br />
C<str<strong>on</strong>g>of</str<strong>on</strong>g>fee World 5 9 41 21 37 55<br />
United States 0 0 0 0 0 0<br />
Tea World 12 31 24 29 30 39<br />
United States 0 0 0 0 0 0<br />
Alcoholic beverages World 13 25 44 54 80 112<br />
United States 0 1 1 2 2 4<br />
N<strong>on</strong>alcoholic beverages World 17 25 34 38 54 53<br />
United States 0 1 1 2 2 2<br />
Ethanol World 6 103 157 19 12 53<br />
United States 0 0 0 0 0 0<br />
Sugar, sweeteners, c<strong>on</strong>fecti<strong>on</strong>ery World 22 215 271 24 46 69<br />
United States 2 3 2 4 5 4<br />
Cocoa products World 15 18 23 28 41 58<br />
United States 0 0 0 0 0 0<br />
Spices<br />
Cloves World 21 30 43 40 39 45<br />
United States 0 0 0 0 0 0<br />
Pepper World 23 21 29 34 38 51<br />
United States 0 0 0 0 0 0<br />
Other spices World 36 42 63 51 65 79<br />
United States 0 1 1 1 1 1<br />
Other<br />
Miscellaneous processed foods World 22 26 32 34 27 39<br />
United States 9 12 13 14 5 8<br />
Gum <str<strong>on</strong>g>and</str<strong>on</strong>g> thickeners World 21 30 39 52 47 60<br />
United States 0 0 0 0 0 0<br />
2-3


