Statistics for Decision- Making in Business - Maricopa Community ...
Statistics for Decision- Making in Business - Maricopa Community ...
Statistics for Decision- Making in Business - Maricopa Community ...

You also want an ePaper? Increase the reach of your titles
YUMPU automatically turns print PDFs into web optimized ePapers that Google loves.
Probability (Relative Frequency)<br />
Chapter 5<br />
Cont<strong>in</strong>uous Probability Distributions<br />
Up until this po<strong>in</strong>t, we have only considered distribution that have discrete values – non-negative<br />
<strong>in</strong>tegers. There are many variables, however, that are cont<strong>in</strong>uous <strong>in</strong> nature. In fact, almost every<br />
variable you studied <strong>in</strong> algebra and calculus was cont<strong>in</strong>uous!<br />
Take, <strong>for</strong> example, heights of NBA basketball players, hourly wage, response time of a database<br />
server, temperature, depth of a lake, the value of a share of Intel stock, and the lifespan of a car<br />
eng<strong>in</strong>e, to name just a very few. These are all variables that can take on <strong>in</strong>f<strong>in</strong>itely many values,<br />
even with<strong>in</strong> a limited range. For example, the response time of a database could be 0 seconds and<br />
1 second. It could be 0.01 seconds, 0.00001 seconds, or 0.98727495 seconds.<br />
5.1 The Ideas Beh<strong>in</strong>d the Cont<strong>in</strong>uous Distribution<br />
5.1.1 Conceptual Approach to Cont<strong>in</strong>uous Distributions<br />
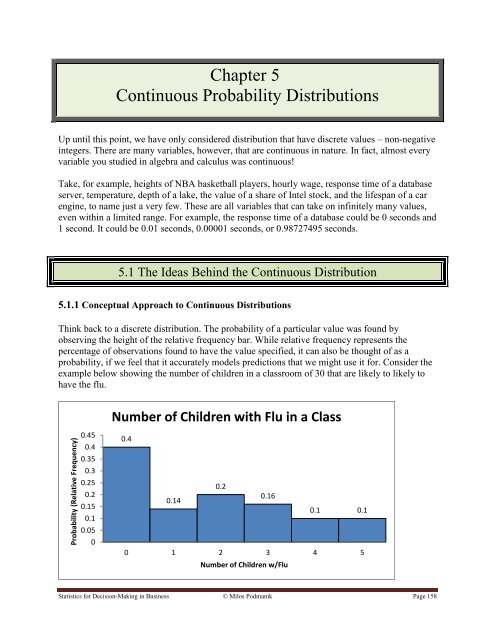
Th<strong>in</strong>k back to a discrete distribution. The probability of a particular value was found by<br />
observ<strong>in</strong>g the height of the relative frequency bar. While relative frequency represents the<br />
percentage of observations found to have the value specified, it can also be thought of as a<br />
probability, if we feel that it accurately models predictions that we might use it <strong>for</strong>. Consider the<br />
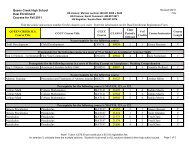
example below show<strong>in</strong>g the number of children <strong>in</strong> a classroom of 30 that are likely to likely to<br />
have the flu.<br />
Number of Children with Flu <strong>in</strong> a Class<br />
0.45<br />
0.4<br />
0.35<br />
0.3<br />
0.25<br />
0.2<br />
0.15<br />
0.1<br />
0.05<br />
0<br />
0.4<br />
0.2<br />
0.14<br />
0.16<br />
0.1 0.1<br />
0 1 2 3 4 5<br />
Number of Children w/Flu<br />
<strong>Statistics</strong> <strong>for</strong> <strong>Decision</strong>-<strong>Mak<strong>in</strong>g</strong> <strong>in</strong> Bus<strong>in</strong>ess © Milos Podmanik Page 158