Statistics for Decision- Making in Business - Maricopa Community ...
Statistics for Decision- Making in Business - Maricopa Community ...
Statistics for Decision- Making in Business - Maricopa Community ...

You also want an ePaper? Increase the reach of your titles
YUMPU automatically turns print PDFs into web optimized ePapers that Google loves.
22.2666666666667 to<br />
22.7666666666667<br />
22.7666666666667 to<br />
23.2666666666667<br />
23.2666666666667 to<br />
23.7666666666667<br />
23.7666666666667 to<br />
24.2666666666667<br />
24.2666666666667 to<br />
24.7666666666667<br />
24.7666666666667 to<br />
25.2666666666667<br />
25.2666666666667 to<br />
25.7666666666667<br />
25.7666666666667 to<br />
26.2666666666667<br />
26.2666666666667 to<br />
26.7666666666667<br />
26.7666666666667 to<br />
27.2666666666667<br />
27.2666666666667 to<br />
27.7666666666667<br />
27.7666666666667 to<br />
28.2666666666667<br />
28.2666666666667 to<br />
28.7666666666667<br />
28.7666666666667 to<br />
29.2666666666667<br />
29.2666666666667 to<br />
29.7666666666667<br />
29.7666666666667><br />
Now, back to our example…<br />
If we have truly collected a random sample, then we should be able to th<strong>in</strong>k about the sample as<br />
a small population. If this is a small population, then we should be able to sample from it. We<br />
will draw random samples of size from the small “population” which is also of size<br />
. Sounds strange, but we will sample with replacement, so it is possible to resample the<br />
same value multiple times.<br />
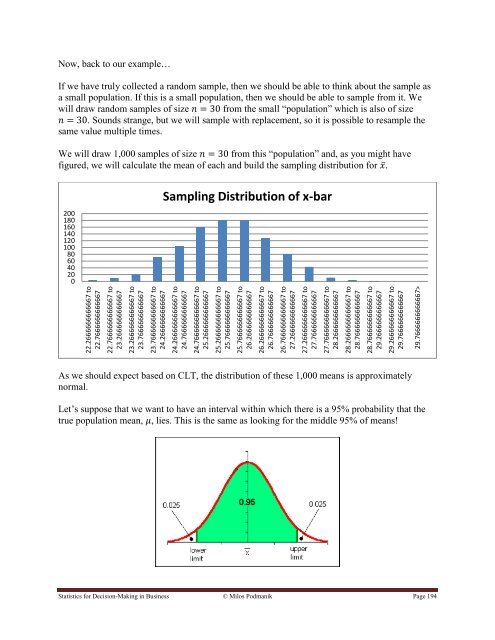
We will draw 1,000 samples of size from this “population” and, as you might have<br />
figured, we will calculate the mean of each and build the sampl<strong>in</strong>g distribution <strong>for</strong> ̅.<br />
200<br />
180<br />
160<br />
140<br />
120<br />
100<br />
80<br />
60<br />
40<br />
20<br />
0<br />
Sampl<strong>in</strong>g Distribution of x-bar<br />
As we should expect based on CLT, the distribution of these 1,000 means is approximately<br />
normal.<br />
Let‟s suppose that we want to have an <strong>in</strong>terval with<strong>in</strong> which there is a 95% probability that the<br />
true population mean, , lies. This is the same as look<strong>in</strong>g <strong>for</strong> the middle 95% of means!<br />
<strong>Statistics</strong> <strong>for</strong> <strong>Decision</strong>-<strong>Mak<strong>in</strong>g</strong> <strong>in</strong> Bus<strong>in</strong>ess © Milos Podmanik Page 194