Statistics for Decision- Making in Business - Maricopa Community ...
Statistics for Decision- Making in Business - Maricopa Community ...
Statistics for Decision- Making in Business - Maricopa Community ...

You also want an ePaper? Increase the reach of your titles
YUMPU automatically turns print PDFs into web optimized ePapers that Google loves.
If the deviations are small (good th<strong>in</strong>g!), then the squared deviations will be small, and so the<br />
sum of squares will be small. This implies a small deviation.<br />
So, a large standard deviation means that there is a lot of variability, or that the values are vastly<br />
different from one another. A small standard deviation means the values <strong>in</strong> the data set are quite<br />
alike. In the near future, you'll see why it is important to have a small standard deviation. In<br />
general, as the variance and standard deviation get larger, our ability to make precise statements<br />
about the population quickly evaporates.<br />
We will be us<strong>in</strong>g variance and standard deviation consistently <strong>for</strong> the rest of the semester. It is<br />
important to get com<strong>for</strong>table with it.<br />
2.4.3 Do Population Variances and Standard Deviations Fall <strong>in</strong>to Play<br />
Indeed they do. Do you th<strong>in</strong>k that we can f<strong>in</strong>d them Def<strong>in</strong>itely not! The population variance<br />
requires the use of the population mean, . How do we get We take the average of all the<br />
values <strong>in</strong> the entire population. S<strong>in</strong>ce we typically don't know this value, we also typically don't<br />
know the population variance, so certa<strong>in</strong>ly we don't know the population standard deviation<br />
(s<strong>in</strong>ce it's the square root of the population variance).<br />
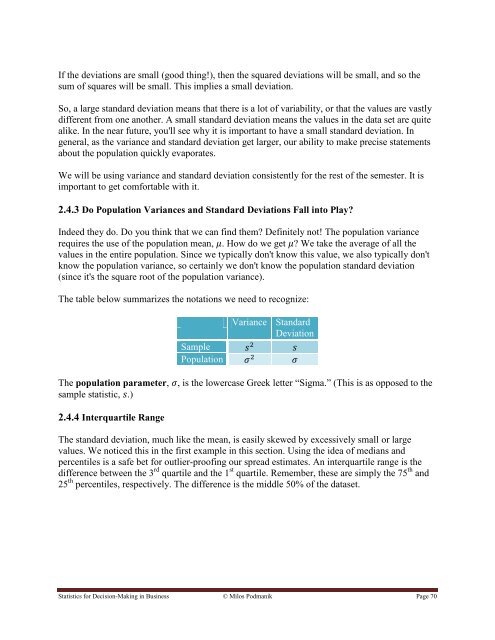
The table below summarizes the notations we need to recognize:<br />
Sample<br />
Population<br />
Variance Standard<br />
Deviation<br />
The population parameter, , is the lowercase Greek letter “Sigma.” (This is as opposed to the<br />
sample statistic, .)<br />
2.4.4 Interquartile Range<br />
The standard deviation, much like the mean, is easily skewed by excessively small or large<br />
values. We noticed this <strong>in</strong> the first example <strong>in</strong> this section. Us<strong>in</strong>g the idea of medians and<br />
percentiles is a safe bet <strong>for</strong> outlier-proof<strong>in</strong>g our spread estimates. An <strong>in</strong>terquartile range is the<br />
difference between the 3 rd quartile and the 1 st quartile. Remember, these are simply the 75 th and<br />
25 th percentiles, respectively. The difference is the middle 50% of the dataset.<br />
<strong>Statistics</strong> <strong>for</strong> <strong>Decision</strong>-<strong>Mak<strong>in</strong>g</strong> <strong>in</strong> Bus<strong>in</strong>ess © Milos Podmanik Page 70