Statistics for Decision- Making in Business - Maricopa Community ...
Statistics for Decision- Making in Business - Maricopa Community ...
Statistics for Decision- Making in Business - Maricopa Community ...

Create successful ePaper yourself
Turn your PDF publications into a flip-book with our unique Google optimized e-Paper software.
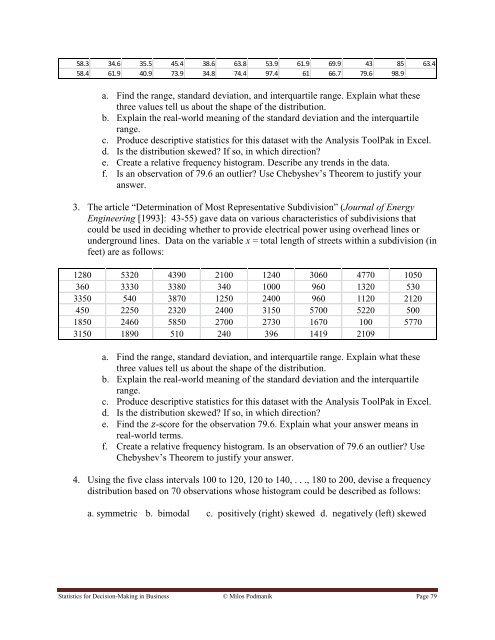
58.3 34.6 35.5 45.4 38.6 63.8 53.9 61.9 69.9 43 85 63.4<br />
58.4 61.9 40.9 73.9 34.8 74.4 97.4 61 66.7 79.6 98.9<br />
a. F<strong>in</strong>d the range, standard deviation, and <strong>in</strong>terquartile range. Expla<strong>in</strong> what these<br />
three values tell us about the shape of the distribution.<br />
b. Expla<strong>in</strong> the real-world mean<strong>in</strong>g of the standard deviation and the <strong>in</strong>terquartile<br />
range.<br />
c. Produce descriptive statistics <strong>for</strong> this dataset with the Analysis ToolPak <strong>in</strong> Excel.<br />
d. Is the distribution skewed If so, <strong>in</strong> which direction<br />
e. Create a relative frequency histogram. Describe any trends <strong>in</strong> the data.<br />
f. Is an observation of 79.6 an outlier Use Chebyshev‟s Theorem to justify your<br />
answer.<br />
3. The article “Determ<strong>in</strong>ation of Most Representative Subdivision” (Journal of Energy<br />
Eng<strong>in</strong>eer<strong>in</strong>g [1993]: 43-55) gave data on various characteristics of subdivisions that<br />
could be used <strong>in</strong> decid<strong>in</strong>g whether to provide electrical power us<strong>in</strong>g overhead l<strong>in</strong>es or<br />
underground l<strong>in</strong>es. Data on the variable x = total length of streets with<strong>in</strong> a subdivision (<strong>in</strong><br />
feet) are as follows:<br />
1280 5320 4390 2100 1240 3060 4770 1050<br />
360 3330 3380 340 1000 960 1320 530<br />
3350 540 3870 1250 2400 960 1120 2120<br />
450 2250 2320 2400 3150 5700 5220 500<br />
1850 2460 5850 2700 2730 1670 100 5770<br />
3150 1890 510 240 396 1419 2109<br />
a. F<strong>in</strong>d the range, standard deviation, and <strong>in</strong>terquartile range. Expla<strong>in</strong> what these<br />
three values tell us about the shape of the distribution.<br />
b. Expla<strong>in</strong> the real-world mean<strong>in</strong>g of the standard deviation and the <strong>in</strong>terquartile<br />
range.<br />
c. Produce descriptive statistics <strong>for</strong> this dataset with the Analysis ToolPak <strong>in</strong> Excel.<br />
d. Is the distribution skewed If so, <strong>in</strong> which direction<br />
e. F<strong>in</strong>d the -score <strong>for</strong> the observation 79.6. Expla<strong>in</strong> what your answer means <strong>in</strong><br />
real-world terms.<br />
f. Create a relative frequency histogram. Is an observation of 79.6 an outlier Use<br />
Chebyshev‟s Theorem to justify your answer.<br />
4. Us<strong>in</strong>g the five class <strong>in</strong>tervals 100 to 120, 120 to 140, . . ., 180 to 200, devise a frequency<br />
distribution based on 70 observations whose histogram could be described as follows:<br />
a. symmetric b. bimodal c. positively (right) skewed d. negatively (left) skewed<br />
<strong>Statistics</strong> <strong>for</strong> <strong>Decision</strong>-<strong>Mak<strong>in</strong>g</strong> <strong>in</strong> Bus<strong>in</strong>ess © Milos Podmanik Page 79