- Page 1 and 2: Statistics for Decision- Making in
- Page 3 and 4: A Note to Students This book is far
- Page 5 and 6: 6.3 Confidence Interval for ̂ 202
- Page 7 and 8: which has undergone no additional r
- Page 9 and 10: of transporting such an animal. Not
- Page 11 and 12: Although far from last, we will con
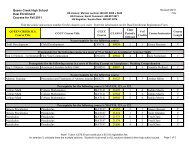
- Page 13 and 14: Account Type Revenue ($) New $5,296
- Page 15 and 16: For the present time, we‟ll proce
- Page 17 and 18: Row Labels Average of Revenue ($) M
- Page 19 and 20: (SOURCE: Essentials of Modern Busin
- Page 21 and 22: 1.3Statistics in Excel When conduct
- Page 23 and 24: We can make it a bit more presentab
- Page 25 and 26: For measures such as the range, Exc
- Page 27 and 28: We get: We can do the same for Old.
- Page 29 and 30: Chapter 2 Visual Representations of
- Page 31 and 32: We now have to enter a formula for
- Page 33 and 34: We know from the data that this val
- Page 35 and 36: Alternatively, it is possible to in
- Page 37 and 38: 16 14 12 10 8 6 Series1 4 2 0 SD D
- Page 39: Selected the copied graph. In Chart
- Page 43 and 44: Frequency 2.2 Visualizing Quantitat
- Page 45 and 46: You can either choose to have Excel
- Page 47 and 48: If we had additional variables, the
- Page 49 and 50: Select PivotChart and select the fi
- Page 51 and 52: Frequency To make solid black lines
- Page 53 and 54: Relative Frequency Histogram of Cal
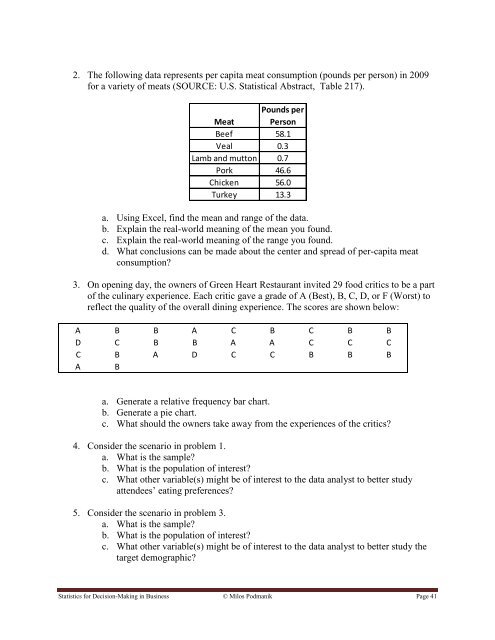
- Page 55 and 56: a. Using Excel, find the mean and r
- Page 57 and 58: ̅ ̅ account for this discrepancy,
- Page 59 and 60: 2.3.2 Percentile Another useful too
- Page 61 and 62: 2.3.4 Rank What if, on the other ha
- Page 63 and 64: Check the “Analysis ToolPak” an
- Page 65 and 66: You‟ll immediately notice that a
- Page 67 and 68: ̅ 2.4 Descriptive Statistics - Var
- Page 69 and 70: √ ∑( ̅) √ √ This is what w
- Page 71 and 72: This gives us a nice measure of how
- Page 73 and 74: We can immediately see the mean and
- Page 75 and 76: Lastly, a normal curve is the most
- Page 77 and 78: Frequency ̅ Histogram of TV's Owne
- Page 79 and 80: 58.3 34.6 35.5 45.4 38.6 63.8 53.9
- Page 81 and 82: Chapter 3 Probability and Decision
- Page 83 and 84: Proportion of Rainy Days 1.2 Propor
- Page 85 and 86: This means that if samples of HFCS
- Page 87 and 88: Are we confident in accusing a lung
- Page 89 and 90: 3.2 Joint Probability In the previo
- Page 91 and 92:
Company 1 Choices Y Y Y Y Y Y Y Y N
- Page 93 and 94:
There is less than a 1% chance that
- Page 95 and 96:
We can now see that the situation i
- Page 97 and 98:
sequence, one ball is chose at rand
- Page 99 and 100:
3.3 Probability of Unions Imagine t
- Page 101 and 102:
Physical .20 .10 .30 Mental .40 .30
- Page 103 and 104:
SOLUTION: We first arrange this inf
- Page 105 and 106:
Homework Problems - 3.3 1. A gaming
- Page 107 and 108:
3.4 Conditional Probability In many
- Page 109 and 110:
) : The Arizona Cardinals make it t
- Page 111 and 112:
We could just as well have written,
- Page 113 and 114:
That is, the probability that the c
- Page 115 and 116:
This can happen in one of two ways:
- Page 117 and 118:
f. All numerical red cards are remo
- Page 119 and 120:
3.5 Combinations and Permutations R
- Page 121 and 122:
1 st Bushel 2 nd Bushel U1 U1 U2 U2
- Page 123 and 124:
Which, in its final state gives: Th
- Page 125 and 126:
Combination - Order Does NOT Matter
- Page 127 and 128:
( ) There is only a .9% chance that
- Page 129 and 130:
1. Are repeats/replacements allowed
- Page 131 and 132:
Object 4 Object 5 Also notice that
- Page 133 and 134:
e. 2. Your classmate was absent whe
- Page 135 and 136:
3.6 Expected Value Imagine that you
- Page 137 and 138:
An expected value is actually not s
- Page 139 and 140:
Where The expected value is: , - (
- Page 141 and 142:
SOLUTION: We first note that there
- Page 143 and 144:
Probability 0.7 0.6 0.5 0.4 0.3 0.2
- Page 145 and 146:
Statistics for Decision-Making in B
- Page 147 and 148:
For men, we see that the most frequ
- Page 149 and 150:
So, we had 10 trials and wanted to
- Page 151 and 152:
Example 1: A fair-two sided coin is
- Page 153 and 154:
( ) ( ) ( ) ( ) Example 2: A fair,
- Page 155 and 156:
Expected Value of a Binomial Random
- Page 157 and 158:
f. What is the probability that g.
- Page 159 and 160:
Probability For instance, we see th
- Page 161 and 162:
Density 0.25 Time Speng Waiting in
- Page 163 and 164:
Suppose we wish to find ( ), that i
- Page 165 and 166:
Density Resulting in a standard dev
- Page 167 and 168:
Density Without going into detail h
- Page 169 and 170:
a. What is the probability that the
- Page 171 and 172:
Statistics for Decision-Making in B
- Page 173 and 174:
As you can see, this is a difficult
- Page 175 and 176:
We wish to know the area of the sha
- Page 177 and 178:
We can easily find that the probabi
- Page 179 and 180:
In the second section, we can check
- Page 181 and 182:
Chapter 6 Sampling Distributions an
- Page 183 and 184:
Thus, the standard deviation would
- Page 185 and 186:
1.7 to 1.8 1.8 to 1.9 1.9 to 2 2 to
- Page 187 and 188:
2.4 to 2.5 2.5 to 2.6 2.6 to 2.7 2.
- Page 189 and 190:
The Central Limit Theorem (CLT) has
- Page 191 and 192:
can set this up in our applet by ha
- Page 193 and 194:
3) We cannot use this sample to cal
- Page 195 and 196:
Thus, we need to find the lower and
- Page 197 and 198:
We see that the standard deviation
- Page 199 and 200:
√ The lower limit is: √ And the
- Page 201 and 202:
following data was collected on the
- Page 203 and 204:
{ So, we have a set of twenty 1‟s
- Page 205 and 206:
DULY CAUTIONED: The assumptions her
- Page 207 and 208:
Homework Problems -6.2 1. In a samp
- Page 209 and 210:
Since this is a mathematical questi
- Page 211 and 212:
Example 3: Many older homes have el
- Page 213 and 214:
Hypothesis Test Conclusion Test Say
- Page 215 and 216:
Hypothesis Test Conclusion Since yo
- Page 217 and 218:
SOLUTION: d. A generic conclusion s
- Page 219 and 220:
9. Based on the “Structure of a H
- Page 221 and 222:
1.2 Descriptive VS. Inferential Sta
- Page 223 and 224:
Relative Frequency 35% 30% 25% 20%
- Page 225 and 226:
Symmetric: 35 30 25 20 15 10 5 0 10
- Page 227 and 228:
Repair Cost Mean 971 Standard Error
- Page 229 and 230:
el freq Nitrous Oxide (thous. Tons)
- Page 231 and 232:
Probability Pizza Size Distribution
- Page 233 and 234:
e. ( ) f. ; the average response ti
- Page 235 and 236:
2. a. The long-run proportion of al
- Page 237 and 238:
e. 20% of all children are expected
- Page 239 and 240:
e. The middle 50% score between abo
- Page 241 and 242:
5. b. This might indicate that the
- Page 243 and 244:
̅ We have that ̅ and √ . So our
- Page 245 and 246:
6. This is the probability that we