Statistics for Decision- Making in Business - Maricopa Community ...
Statistics for Decision- Making in Business - Maricopa Community ...
Statistics for Decision- Making in Business - Maricopa Community ...

Create successful ePaper yourself
Turn your PDF publications into a flip-book with our unique Google optimized e-Paper software.
3.1 The Idea of Probability<br />
In this section, we‟ll address what probability is (and isn‟t).<br />
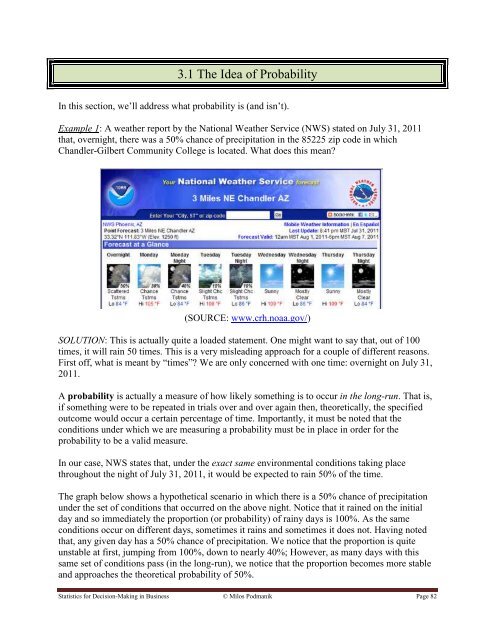
Example 1: A weather report by the National Weather Service (NWS) stated on July 31, 2011<br />
that, overnight, there was a 50% chance of precipitation <strong>in</strong> the 85225 zip code <strong>in</strong> which<br />
Chandler-Gilbert <strong>Community</strong> College is located. What does this mean<br />
(SOURCE: www.crh.noaa.gov/)<br />
SOLUTION: This is actually quite a loaded statement. One might want to say that, out of 100<br />
times, it will ra<strong>in</strong> 50 times. This is a very mislead<strong>in</strong>g approach <strong>for</strong> a couple of different reasons.<br />
First off, what is meant by “times” We are only concerned with one time: overnight on July 31,<br />
2011.<br />
A probability is actually a measure of how likely someth<strong>in</strong>g is to occur <strong>in</strong> the long-run. That is,<br />
if someth<strong>in</strong>g were to be repeated <strong>in</strong> trials over and over aga<strong>in</strong> then, theoretically, the specified<br />
outcome would occur a certa<strong>in</strong> percentage of time. Importantly, it must be noted that the<br />
conditions under which we are measur<strong>in</strong>g a probability must be <strong>in</strong> place <strong>in</strong> order <strong>for</strong> the<br />
probability to be a valid measure.<br />
In our case, NWS states that, under the exact same environmental conditions tak<strong>in</strong>g place<br />
throughout the night of July 31, 2011, it would be expected to ra<strong>in</strong> 50% of the time.<br />
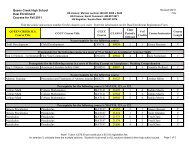
The graph below shows a hypothetical scenario <strong>in</strong> which there is a 50% chance of precipitation<br />
under the set of conditions that occurred on the above night. Notice that it ra<strong>in</strong>ed on the <strong>in</strong>itial<br />
day and so immediately the proportion (or probability) of ra<strong>in</strong>y days is 100%. As the same<br />
conditions occur on different days, sometimes it ra<strong>in</strong>s and sometimes it does not. Hav<strong>in</strong>g noted<br />
that, any given day has a 50% chance of precipitation. We notice that the proportion is quite<br />
unstable at first, jump<strong>in</strong>g from 100%, down to nearly 40%; However, as many days with this<br />
same set of conditions pass (<strong>in</strong> the long-run), we notice that the proportion becomes more stable<br />
and approaches the theoretical probability of 50%.<br />
<strong>Statistics</strong> <strong>for</strong> <strong>Decision</strong>-<strong>Mak<strong>in</strong>g</strong> <strong>in</strong> Bus<strong>in</strong>ess © Milos Podmanik Page 82