Statistics for Decision- Making in Business - Maricopa Community ...
Statistics for Decision- Making in Business - Maricopa Community ...
Statistics for Decision- Making in Business - Maricopa Community ...

You also want an ePaper? Increase the reach of your titles
YUMPU automatically turns print PDFs into web optimized ePapers that Google loves.
Thus, we need to f<strong>in</strong>d the lower and upper limits <strong>for</strong> this <strong>in</strong>terval by f<strong>in</strong>d<strong>in</strong>g the 2.5 percentile<br />
and the 97.5 percentile. In Excel, we can do this by us<strong>in</strong>g the percentile() function. We get:<br />
Upper (97.5 percentile): 27.50<br />
Lower (2.5 percentile): 23.60<br />
Thus, we can say that we are 95% confident that the true population mean is between 23.6 years<br />
and 27.5 years. In other words, there is a 95% probability that we have “trapped” the population<br />
mean between our lower and upper limit. Said one other way, 95% of all sample means, when<br />
the variability from sample to sample is taken <strong>in</strong>to account, are between these lower and upper<br />
limits. If this is representative of the population, then we should believe that 95% of the time, we<br />
will have means between these two values.<br />
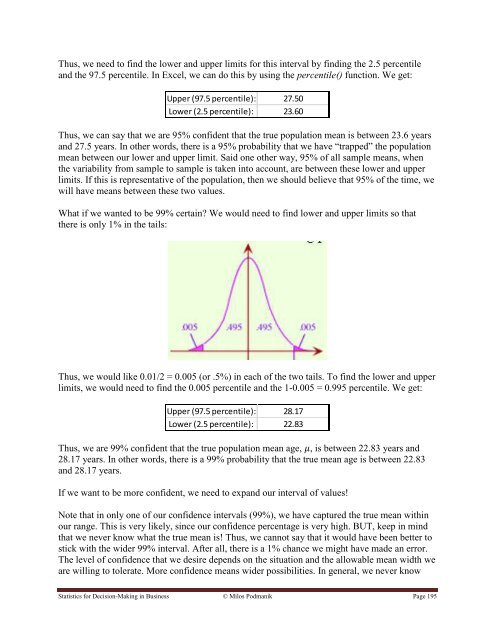
What if we wanted to be 99% certa<strong>in</strong> We would need to f<strong>in</strong>d lower and upper limits so that<br />
there is only 1% <strong>in</strong> the tails:<br />
Thus, we would like 0.01/2 = 0.005 (or .5%) <strong>in</strong> each of the two tails. To f<strong>in</strong>d the lower and upper<br />
limits, we would need to f<strong>in</strong>d the 0.005 percentile and the 1-0.005 = 0.995 percentile. We get:<br />
Upper (97.5 percentile): 28.17<br />
Lower (2.5 percentile): 22.83<br />
Thus, we are 99% confident that the true population mean age, , is between 22.83 years and<br />
28.17 years. In other words, there is a 99% probability that the true mean age is between 22.83<br />
and 28.17 years.<br />
If we want to be more confident, we need to expand our <strong>in</strong>terval of values!<br />
Note that <strong>in</strong> only one of our confidence <strong>in</strong>tervals (99%), we have captured the true mean with<strong>in</strong><br />
our range. This is very likely, s<strong>in</strong>ce our confidence percentage is very high. BUT, keep <strong>in</strong> m<strong>in</strong>d<br />
that we never know what the true mean is! Thus, we cannot say that it would have been better to<br />
stick with the wider 99% <strong>in</strong>terval. After all, there is a 1% chance we might have made an error.<br />
The level of confidence that we desire depends on the situation and the allowable mean width we<br />
are will<strong>in</strong>g to tolerate. More confidence means wider possibilities. In general, we never know<br />
<strong>Statistics</strong> <strong>for</strong> <strong>Decision</strong>-<strong>Mak<strong>in</strong>g</strong> <strong>in</strong> Bus<strong>in</strong>ess © Milos Podmanik Page 195