Statistics for Decision- Making in Business - Maricopa Community ...
Statistics for Decision- Making in Business - Maricopa Community ...
Statistics for Decision- Making in Business - Maricopa Community ...

You also want an ePaper? Increase the reach of your titles
YUMPU automatically turns print PDFs into web optimized ePapers that Google loves.
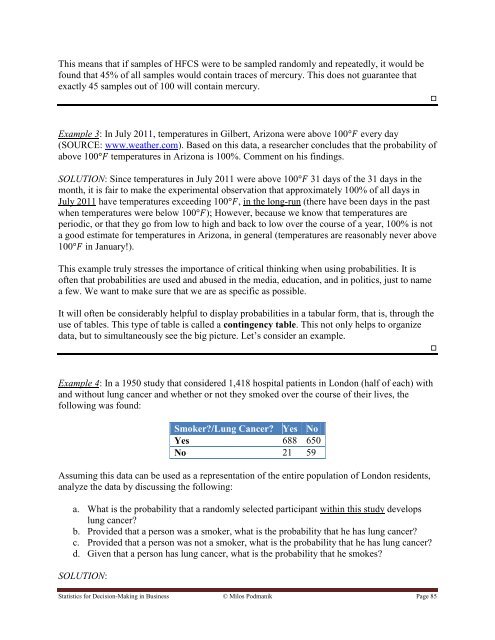
This means that if samples of HFCS were to be sampled randomly and repeatedly, it would be<br />
found that 45% of all samples would conta<strong>in</strong> traces of mercury. This does not guarantee that<br />
exactly 45 samples out of 100 will conta<strong>in</strong> mercury.<br />
Example 3: In July 2011, temperatures <strong>in</strong> Gilbert, Arizona were above 100 every day<br />
(SOURCE: www.weather.com). Based on this data, a researcher concludes that the probability of<br />
above 100 temperatures <strong>in</strong> Arizona is 100%. Comment on his f<strong>in</strong>d<strong>in</strong>gs.<br />
SOLUTION: S<strong>in</strong>ce temperatures <strong>in</strong> July 2011 were above 100 31 days of the 31 days <strong>in</strong> the<br />
month, it is fair to make the experimental observation that approximately 100% of all days <strong>in</strong><br />
July 2011 have temperatures exceed<strong>in</strong>g 100 , <strong>in</strong> the long-run (there have been days <strong>in</strong> the past<br />
when temperatures were below 100 ); However, because we know that temperatures are<br />
periodic, or that they go from low to high and back to low over the course of a year, 100% is not<br />
a good estimate <strong>for</strong> temperatures <strong>in</strong> Arizona, <strong>in</strong> general (temperatures are reasonably never above<br />
100 <strong>in</strong> January!).<br />
This example truly stresses the importance of critical th<strong>in</strong>k<strong>in</strong>g when us<strong>in</strong>g probabilities. It is<br />
often that probabilities are used and abused <strong>in</strong> the media, education, and <strong>in</strong> politics, just to name<br />
a few. We want to make sure that we are as specific as possible.<br />
It will often be considerably helpful to display probabilities <strong>in</strong> a tabular <strong>for</strong>m, that is, through the<br />
use of tables. This type of table is called a cont<strong>in</strong>gency table. This not only helps to organize<br />
data, but to simultaneously see the big picture. Let‟s consider an example.<br />
Example 4: In a 1950 study that considered 1,418 hospital patients <strong>in</strong> London (half of each) with<br />
and without lung cancer and whether or not they smoked over the course of their lives, the<br />
follow<strong>in</strong>g was found:<br />
Smoker/Lung Cancer Yes No<br />
Yes 688 650<br />
No 21 59<br />
Assum<strong>in</strong>g this data can be used as a representation of the entire population of London residents,<br />
analyze the data by discuss<strong>in</strong>g the follow<strong>in</strong>g:<br />
a. What is the probability that a randomly selected participant with<strong>in</strong> this study develops<br />
lung cancer<br />
b. Provided that a person was a smoker, what is the probability that he has lung cancer<br />
c. Provided that a person was not a smoker, what is the probability that he has lung cancer<br />
d. Given that a person has lung cancer, what is the probability that he smokes<br />
SOLUTION:<br />
<strong>Statistics</strong> <strong>for</strong> <strong>Decision</strong>-<strong>Mak<strong>in</strong>g</strong> <strong>in</strong> Bus<strong>in</strong>ess © Milos Podmanik Page 85