Statistics for Decision- Making in Business - Maricopa Community ...
Statistics for Decision- Making in Business - Maricopa Community ...
Statistics for Decision- Making in Business - Maricopa Community ...

Create successful ePaper yourself
Turn your PDF publications into a flip-book with our unique Google optimized e-Paper software.
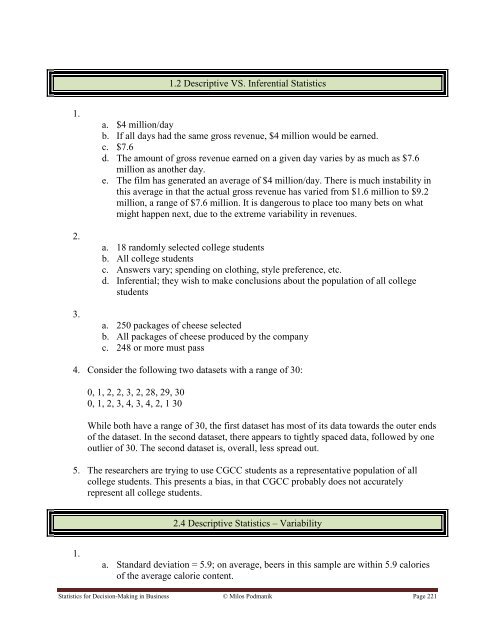
1.2 Descriptive VS. Inferential <strong>Statistics</strong><br />
1.<br />
2.<br />
3.<br />
a. $4 million/day<br />
b. If all days had the same gross revenue, $4 million would be earned.<br />
c. $7.6<br />
d. The amount of gross revenue earned on a given day varies by as much as $7.6<br />
million as another day.<br />
e. The film has generated an average of $4 million/day. There is much <strong>in</strong>stability <strong>in</strong><br />
this average <strong>in</strong> that the actual gross revenue has varied from $1.6 million to $9.2<br />
million, a range of $7.6 million. It is dangerous to place too many bets on what<br />
might happen next, due to the extreme variability <strong>in</strong> revenues.<br />
a. 18 randomly selected college students<br />
b. All college students<br />
c. Answers vary; spend<strong>in</strong>g on cloth<strong>in</strong>g, style preference, etc.<br />
d. Inferential; they wish to make conclusions about the population of all college<br />
students<br />
a. 250 packages of cheese selected<br />
b. All packages of cheese produced by the company<br />
c. 248 or more must pass<br />
4. Consider the follow<strong>in</strong>g two datasets with a range of 30:<br />
0, 1, 2, 2, 3, 2, 28, 29, 30<br />
0, 1, 2, 3, 4, 3, 4, 2, 1 30<br />
While both have a range of 30, the first dataset has most of its data towards the outer ends<br />
of the dataset. In the second dataset, there appears to tightly spaced data, followed by one<br />
outlier of 30. The second dataset is, overall, less spread out.<br />
5. The researchers are try<strong>in</strong>g to use CGCC students as a representative population of all<br />
college students. This presents a bias, <strong>in</strong> that CGCC probably does not accurately<br />
represent all college students.<br />
2.4 Descriptive <strong>Statistics</strong> – Variability<br />
1.<br />
a. Standard deviation = 5.9; on average, beers <strong>in</strong> this sample are with<strong>in</strong> 5.9 calories<br />
of the average calorie content.<br />
<strong>Statistics</strong> <strong>for</strong> <strong>Decision</strong>-<strong>Mak<strong>in</strong>g</strong> <strong>in</strong> Bus<strong>in</strong>ess © Milos Podmanik Page 221