Statistics for Decision- Making in Business - Maricopa Community ...
Statistics for Decision- Making in Business - Maricopa Community ...
Statistics for Decision- Making in Business - Maricopa Community ...

Create successful ePaper yourself
Turn your PDF publications into a flip-book with our unique Google optimized e-Paper software.
Frequency<br />
10<br />
9<br />
8<br />
7<br />
6<br />
5<br />
4<br />
3<br />
2<br />
1<br />
0<br />
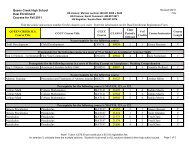
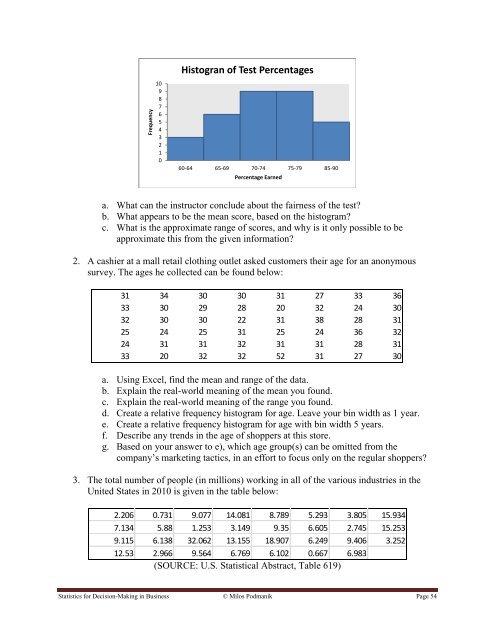
Histogran of Test Percentages<br />
60-64 65-69 70-74 75-79 85-90<br />
Percentage Earned<br />
a. What can the <strong>in</strong>structor conclude about the fairness of the test<br />
b. What appears to be the mean score, based on the histogram<br />
c. What is the approximate range of scores, and why is it only possible to be<br />
approximate this from the given <strong>in</strong><strong>for</strong>mation<br />
2. A cashier at a mall retail cloth<strong>in</strong>g outlet asked customers their age <strong>for</strong> an anonymous<br />
survey. The ages he collected can be found below:<br />
31 34 30 30 31 27 33 36<br />
33 30 29 28 20 32 24 30<br />
32 30 30 22 31 38 28 31<br />
25 24 25 31 25 24 36 32<br />
24 31 31 32 31 31 28 31<br />
33 20 32 32 52 31 27 30<br />
a. Us<strong>in</strong>g Excel, f<strong>in</strong>d the mean and range of the data.<br />
b. Expla<strong>in</strong> the real-world mean<strong>in</strong>g of the mean you found.<br />
c. Expla<strong>in</strong> the real-world mean<strong>in</strong>g of the range you found.<br />
d. Create a relative frequency histogram <strong>for</strong> age. Leave your b<strong>in</strong> width as 1 year.<br />
e. Create a relative frequency histogram <strong>for</strong> age with b<strong>in</strong> width 5 years.<br />
f. Describe any trends <strong>in</strong> the age of shoppers at this store.<br />
g. Based on your answer to e), which age group(s) can be omitted from the<br />
company‟s market<strong>in</strong>g tactics, <strong>in</strong> an ef<strong>for</strong>t to focus only on the regular shoppers<br />
3. The total number of people (<strong>in</strong> millions) work<strong>in</strong>g <strong>in</strong> all of the various <strong>in</strong>dustries <strong>in</strong> the<br />
United States <strong>in</strong> 2010 is given <strong>in</strong> the table below:<br />
2.206 0.731 9.077 14.081 8.789 5.293 3.805 15.934<br />
7.134 5.88 1.253 3.149 9.35 6.605 2.745 15.253<br />
9.115 6.138 32.062 13.155 18.907 6.249 9.406 3.252<br />
12.53 2.966 9.564 6.769 6.102 0.667 6.983<br />
(SOURCE: U.S. Statistical Abstract, Table 619)<br />
<strong>Statistics</strong> <strong>for</strong> <strong>Decision</strong>-<strong>Mak<strong>in</strong>g</strong> <strong>in</strong> Bus<strong>in</strong>ess © Milos Podmanik Page 54