Statistics for Decision- Making in Business - Maricopa Community ...
Statistics for Decision- Making in Business - Maricopa Community ...
Statistics for Decision- Making in Business - Maricopa Community ...
Create successful ePaper yourself
Turn your PDF publications into a flip-book with our unique Google optimized e-Paper software.
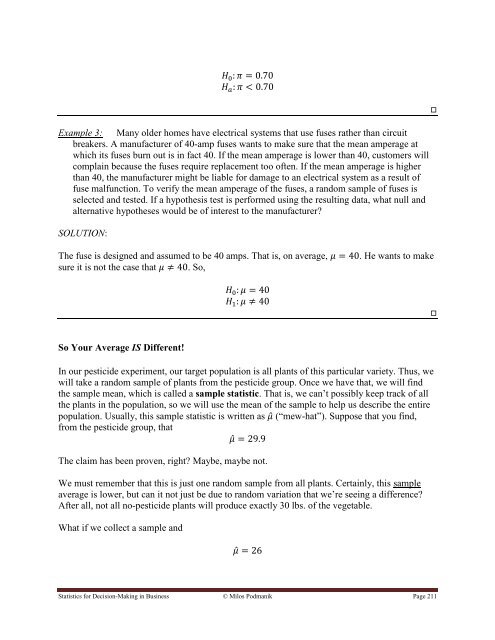
Example 3: Many older homes have electrical systems that use fuses rather than circuit<br />
breakers. A manufacturer of 40-amp fuses wants to make sure that the mean amperage at<br />
which its fuses burn out is <strong>in</strong> fact 40. If the mean amperage is lower than 40, customers will<br />
compla<strong>in</strong> because the fuses require replacement too often. If the mean amperage is higher<br />
than 40, the manufacturer might be liable <strong>for</strong> damage to an electrical system as a result of<br />
fuse malfunction. To verify the mean amperage of the fuses, a random sample of fuses is<br />
selected and tested. If a hypothesis test is per<strong>for</strong>med us<strong>in</strong>g the result<strong>in</strong>g data, what null and<br />
alternative hypotheses would be of <strong>in</strong>terest to the manufacturer<br />
SOLUTION:<br />
The fuse is designed and assumed to be 40 amps. That is, on average,<br />
sure it is not the case that . So,<br />
. He wants to make<br />
So Your Average IS Different!<br />
In our pesticide experiment, our target population is all plants of this particular variety. Thus, we<br />
will take a random sample of plants from the pesticide group. Once we have that, we will f<strong>in</strong>d<br />
the sample mean, which is called a sample statistic. That is, we can‟t possibly keep track of all<br />
the plants <strong>in</strong> the population, so we will use the mean of the sample to help us describe the entire<br />
population. Usually, this sample statistic is written as ̂ (“mew-hat”). Suppose that you f<strong>in</strong>d,<br />
from the pesticide group, that<br />
̂<br />
The claim has been proven, right Maybe, maybe not.<br />
We must remember that this is just one random sample from all plants. Certa<strong>in</strong>ly, this sample<br />
average is lower, but can it not just be due to random variation that we‟re see<strong>in</strong>g a difference<br />
After all, not all no-pesticide plants will produce exactly 30 lbs. of the vegetable.<br />
What if we collect a sample and<br />
̂<br />
<strong>Statistics</strong> <strong>for</strong> <strong>Decision</strong>-<strong>Mak<strong>in</strong>g</strong> <strong>in</strong> Bus<strong>in</strong>ess © Milos Podmanik Page 211


