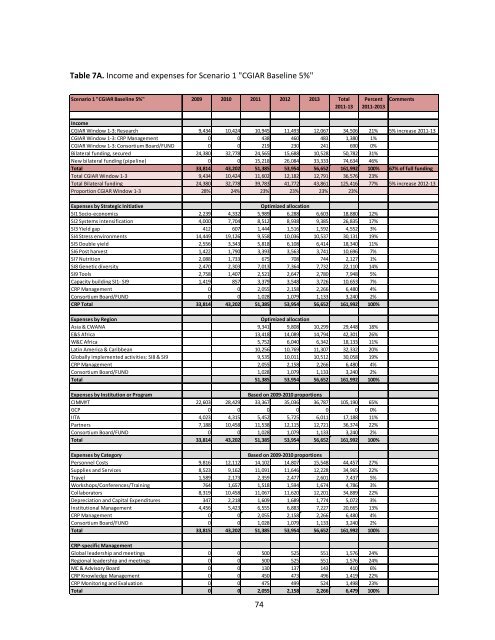
Table 7A. Income and expenses for Scenario 1 "CGIAR Baseline 5%" Scenario 1 "CGIAR Baseline 5%" 2009 2010 2011 2012 2013 Total 2011‐13 Percent 2011‐2013 Comments Income CGIAR Window 1‐3: Research 9,434 10,424 10,945 11,493 12,067 34,506 21% 5% increase 2011‐13 CGIAR Window 1‐3: CRP Management 0 0 438 460 483 1,380 1% CGIAR Window 1‐3: Consortium Board/FUND 0 0 219 230 241 690 0% Bilateral funding, secured 24,380 32,778 24,565 15,688 10,528 50,782 31% New bilateral funding (pipeline) 0 0 15,218 26,084 33,333 74,634 46% Total 33,814 43,202 51,385 53,954 56,652 161,992 100% 67% of full funding Total CGIAR Window 1‐3 9,434 10,424 11,602 12,182 12,791 36,576 23% Total Bilateral funding 24,380 32,778 39,783 41,772 43,861 125,416 77% 5% increase 2012‐13 Proportion CGIAR Window 1‐3 28% 24% 23% 23% 23% 23% Expenses by Strategic Initiative Optimized allocation SI1 Socio‐economics 2,239 4,332 5,989 6,288 6,603 18,880 12% SI2 Systems intensification 4,000 7,704 8,512 8,938 9,385 26,835 17% SI3 Yield gap 412 607 1,444 1,516 1,592 4,552 3% SI4 Stress environments 14,449 19,126 9,558 10,036 10,537 30,131 19% SI5 Double yield 2,556 3,343 5,818 6,108 6,414 18,340 11% SI6 Post harvest 1,422 1,790 3,393 3,563 3,741 10,696 7% SI7 Nutrition 2,088 1,733 675 708 744 2,127 1% SI8 Genetic diversity 2,470 2,303 7,013 7,364 7,732 22,110 14% SI9 Tools 2,758 1,407 2,521 2,647 2,780 7,948 5% Capacity building SI1‐ SI9 1,419 857 3,379 3,548 3,726 10,653 7% CRP Management 0 0 2,055 2,158 2,266 6,480 4% Consortium Board/FUND 0 0 1,028 1,079 1,133 3,240 2% CRP Total 33,814 43,202 51,385 53,954 56,652 161,992 100% Expenses by Region Optimized allocation Asia & CWANA 9,341 9,808 10,299 29,448 18% E&S Africa 13,418 14,089 14,794 42,301 26% W&C Africa 5,752 6,040 6,342 18,133 11% Latin America & Caribbean 10,256 10,769 11,307 32,332 20% Globally implemented activities: SI8 & SI9 9,535 10,011 10,512 30,058 19% CRP Management 2,055 2,158 2,266 6,480 4% Consortium Board/FUND 1,028 1,079 1,133 3,240 2% Total 51,385 53,954 56,652 161,992 100% Expenses by Institution or Program Based on 2009‐2010 proportions CIMMYT 22,603 28,429 33,367 35,036 36,787 105,190 65% GCP 0 0 0 0 0 0 0% IITA 4,023 4,315 5,452 5,725 6,011 17,188 11% Partners 7,188 10,458 11,538 12,115 12,721 36,374 22% Consortium Board/FUND 0 0 1,028 1,079 1,133 3,240 2% Total 33,814 43,202 51,385 53,954 56,652 161,992 100% Expenses by Category Based on 2009‐2010 proportions Personnel Costs 9,816 12,112 14,102 14,807 15,548 44,457 27% Supplies and Services 8,523 9,162 11,091 11,646 12,228 34,965 22% Travel 1,589 2,173 2,359 2,477 2,601 7,437 5% Workshops/Conferences/Training 764 1,657 1,518 1,594 1,674 4,786 3% Collaborators 8,319 10,458 11,067 11,620 12,201 34,889 22% Depreciation and Capital Expenditures 347 2,218 1,609 1,689 1,774 5,072 3% Institutional Management 4,456 5,423 6,555 6,883 7,227 20,665 13% CRP Management 0 0 2,055 2,158 2,266 6,480 4% Consortium Board/FUND 0 0 1,028 1,079 1,133 3,240 2% Total 33,815 43,202 51,385 53,954 56,652 161,992 100% CRP‐specific Management Global leadership and meetings 0 0 500 525 551 1,576 24% Regional leadership and meetings 0 0 500 525 551 1,576 24% MC & Advisory Board 0 0 130 137 143 410 6% CRP Knowledge Management 0 0 450 473 496 1,419 22% CRP Monitoring and Evaluation 0 0 475 499 524 1,498 23% Total 0 0 2,055 2,158 2,266 6,479 100% 74
Table 7B. Income and expenses for Scenario 2 "CGIAR Baseline 5% + New Management" Scenario 2 "CGIAR Baseline 5% + New Management" 2009 2010 2011 2012 2013 Total 2011‐13 Percent 2011‐2013 Comments Income CGIAR Window 1‐3: Research 9,434 10,424 10,945 11,493 12,067 34,506 20% 5% increase 2011‐13 CGIAR Window 1‐3: CRP Management 0 0 2,159 2,267 2,380 6,805 4% All management CGIAR Window 1‐3: Consortium Board/FUND 0 0 1,079 1,133 1,190 3,403 2% All management Bilateral funding, secured 24,380 32,778 24,565 15,688 10,528 50,782 30% New bilateral funding (pipeline) 0 0 15,218 26,084 33,333 74,634 44% Total 33,814 43,202 53,966 56,665 59,498 170,129 100% 71% of full funding Total CGIAR Window 1‐3 9,434 10,424 14,183 14,893 15,637 44,713 26% Total Bilateral funding 24,380 32,778 39,783 41,772 43,861 125,416 74% 5% increase 2012‐13 Proportion CGIAR Window 1‐3 28% 24% 26% 26% 26% 26% Expenses by Strategic Initiative Optimized allocation SI1 Socio‐economics 2,239 4,332 6,290 6,604 6,935 19,829 12% SI2 Systems intensification 4,000 7,704 8,940 9,387 9,856 28,183 17% SI3 Yield gap 412 607 1,516 1,592 1,672 4,781 3% SI4 Stress environments 14,449 19,126 10,038 10,540 11,067 31,644 19% SI5 Double yield 2,556 3,343 6,110 6,415 6,736 19,261 11% SI6 Post harvest 1,422 1,790 3,563 3,742 3,929 11,234 7% SI7 Nutrition 2,088 1,733 709 744 781 2,234 1% SI8 Genetic diversity 2,470 2,303 7,366 7,734 8,121 23,220 14% SI9 Tools 2,758 1,407 2,648 2,780 2,919 8,348 5% Capacity building SI1‐ SI9 1,419 857 3,549 3,726 3,913 11,188 7% CRP Management 0 0 2,159 2,267 2,380 6,805 4% Consortium Board/FUND 0 0 1,079 1,133 1,190 3,403 2% CRP Total 33,814 43,202 53,966 56,665 59,498 170,129 100% Expenses by Region Optimized allocation Asia & CWANA 9,810 10,301 10,816 30,928 18% E&S Africa 14,092 14,797 15,537 44,426 26% W&C Africa 6,041 6,343 6,660 19,044 11% Latin America & Caribbean 10,771 11,310 11,875 33,956 20% Globally implemented activities: SI8 & SI9 10,014 10,514 11,040 31,568 19% CRP Management 2,159 2,267 2,380 6,805 4% Consortium Board/FUND 1,079 1,133 1,190 3,403 2% Total 53,966 56,665 59,498 170,129 100% Expenses by Institution or Program Based on 2009‐2010 proportions CIMMYT 22,603 28,429 35,043 36,796 38,635 110,474 65% GCP 0 0 0 0 0 0 0% IITA 4,023 4,315 5,726 6,012 6,313 18,052 11% Partners 7,188 10,458 12,118 12,724 13,360 38,201 22% Consortium Board/FUND 0 0 1,079 1,133 1,190 3,403 2% Total 33,814 43,202 53,966 56,665 59,498 170,129 100% Expenses by Category Based on 2009‐2010 proportions Personnel Costs 9,816 12,112 14,810 15,551 16,329 46,690 27% Supplies and Services 8,523 9,162 11,648 12,231 12,842 36,722 22% Travel 1,589 2,173 2,478 2,602 2,732 7,811 5% Workshops/Conferences/Training 764 1,657 1,595 1,674 1,758 5,027 3% Collaborators 8,319 10,458 11,623 12,204 12,814 36,642 22% Depreciation and Capital Expenditures 347 2,218 1,690 1,774 1,863 5,327 3% Institutional Management 4,456 5,423 6,884 7,229 7,590 21,703 13% CRP Management 0 0 2,159 2,267 2,380 6,805 4% Consortium Board/FUND 0 0 1,079 1,133 1,190 3,403 2% Total 33,815 43,202 53,966 56,665 59,498 170,129 100% CRP‐specific Management Global leadership and meetings 0 0 525 551 579 1,655 24% Regional leadership and meetings 0 0 525 551 579 1,655 24% MC & Advisory Board 0 0 140 147 154 441 6% CRP Knowledge Management 0 0 485 509 534 1,527 22% CRP Monitoring and Evaluation 0 0 485 509 534 1,527 22% Total 0 0 2,159 2,267 2,380 6,806 100% 75
- Page 1:
MAIZE ‐ Global Alliance for Impro
- Page 4 and 5:
Abbreviations 1 AFLP CA CBO CEO CGI
- Page 6 and 7:
Executive summary Recurrent food pr
- Page 8 and 9:
All SIs include capacity building t
- Page 10 and 11:
essentially the same land area whil
- Page 12 and 13:
Competing uses for a staple grain A
- Page 14 and 15:
Figure 3. Annual global yield fluct
- Page 16 and 17:
environments and capacity building.
- Page 18 and 19:
productivity while reversing widesp
- Page 20 and 21:
Target Group 3: Poor consumers and
- Page 22 and 23:
poverty reduction, food insecurity,
- Page 24 and 25:
Methods Innovative approaches to a
- Page 26 and 27:
Methods Aggressive development, va
- Page 28 and 29:
Outcomes Novel tools will empower N
- Page 30 and 31:
Based on the maize systems describe
- Page 32 and 33: Program‐level product delivery Pr
- Page 34 and 35: Impact pathways Impact pathways are
- Page 36 and 37: Outcomes for MAIZE as a whole shown
- Page 38 and 39: The portfolio of Strategic Initiati
- Page 40 and 41: Table 2. Summary of impacts of MAIZ
- Page 42 and 43: allocate their time to more product
- Page 44 and 45: fall short of making up the differe
- Page 46 and 47: Priority setting to plan future rev
- Page 48 and 49: Strategic Initiative SI 2. Sustaina
- Page 50 and 51: Strategic Initiative SI 4. Stress t
- Page 52 and 53: Strategic Initiative SI 7. Nutritio
- Page 54 and 55: Partnership principles While the pa
- Page 56 and 57: Based on current staff and partner
- Page 58 and 59: Oversight Committee: This committee
- Page 60 and 61: Review and refine priorities, targe
- Page 62 and 63: Price Trade Policy REDD, PES, Reser
- Page 64 and 65: CGIAR Research Program Outputs from
- Page 66 and 67: Climate change strategy The impact
- Page 68 and 69: Process monitoring will include par
- Page 70 and 71: Given the high costs and difficulti
- Page 72 and 73: the uptake of outputs and the inten
- Page 74 and 75: CIMMYT has developed such partnersh
- Page 76 and 77: 12. Decision makers understand and
- Page 78 and 79: Scaling up and out of methodologies
- Page 80 and 81: Bilateral funding: Following the Co
- Page 84 and 85: Expenses by Strategic Initiative: T
- Page 86 and 87: References Alston, M.J., Norton, W.
- Page 88 and 89: MAIZE Strategic Initiatives Strateg
- Page 90 and 91: Targeting resource‐poor farmers i
- Page 92 and 93: Knowledge of the structure and func
- Page 94 and 95: 2014: Analysis of policy options an
- Page 96 and 97: Strategic Initiative 2. Sustainable
- Page 98 and 99: stress‐tolerant germplasm, better
- Page 100 and 101: Researchable issues Effective appr
- Page 102 and 103: Key milestones 2011: Maize‐based
- Page 104 and 105: Modernizing agriculture through use
- Page 106 and 107: coherent exploratory diagnostic tri
- Page 108 and 109: universities, the private sector (i
- Page 110 and 111: What's new in this initiative? To
- Page 112 and 113: Strategic Initiative 4. Stress‐to
- Page 114 and 115: (mycotoxins) also contaminate grain
- Page 116 and 117: CIMMYT and IITA breeding programs a
- Page 118 and 119: Institutional weaknesses affecting
- Page 120 and 121: Research and development partners C
- Page 122 and 123: What's new in this initiative? Dro
- Page 124 and 125: Gerpacio, R.V. and Pingali, P.L. 20
- Page 126 and 127: gain per year. The physiological ba
- Page 128 and 129: Intellectual property management of
- Page 130 and 131: Other producer‐ or consumer‐rel
- Page 132 and 133:
considered “women’s” crops, a
- Page 134 and 135:
subtropical, mid‐altitude, transi
- Page 136 and 137:
mycotoxin monitoring capacity of re
- Page 138 and 139:
4. Hubs and protocols to phenotype
- Page 140 and 141:
Assuming that low‐cost storage fa
- Page 142 and 143:
Mugo, S., Likhayo, P., Karaya, H.,
- Page 144 and 145:
More than two‐thirds of the globa
- Page 146 and 147:
Commercial QPM seed is currently av
- Page 148 and 149:
Outputs 1. High‐throughput and lo
- Page 150 and 151:
Linkages with other SIs SI 7 will m
- Page 152 and 153:
Meenakshi JV, Johnson N, Manyong V,
- Page 154 and 155:
Compared with the genomes of other
- Page 156 and 157:
Breeding programs will achieve more
- Page 158 and 159:
Strategic Initiative 9. New tools a
- Page 160 and 161:
Through collaboration among CIMMYT,
- Page 162 and 163:
o Generating predictive power of ha
- Page 164 and 165:
generated from CIMMYT and IITA bree
- Page 166 and 167:
Strategic Initiatives 1-9. Summary
- Page 168 and 169:
Techniques of good quality seed pro
- Page 170 and 171:
Annex 1. Population, poor and maize
- Page 172 and 173:
Bolivia, CIF Botswana, Department A
- Page 174 and 175:
Swaziland, Ministry of Agriculture
- Page 176 and 177:
India, Meerut, Sardar Vallabah Bhai
- Page 178 and 179:
Uganda, NASECO Seeds 1996 Ltd Ugand
- Page 180 and 181:
Annex 3. Impact pathways for MAIZE:
- Page 182 and 183:
Main outputs of MAIZE SIs 4. Instit
- Page 184:
Annex 4. CIMMYT maize mega‐enviro