

MnrAq
MnrAq
MnrAq

Create successful ePaper yourself
Turn your PDF publications into a flip-book with our unique Google optimized e-Paper software.
Inventories of CO2 emissions from international shipping 2007–2012 79<br />
Year<br />
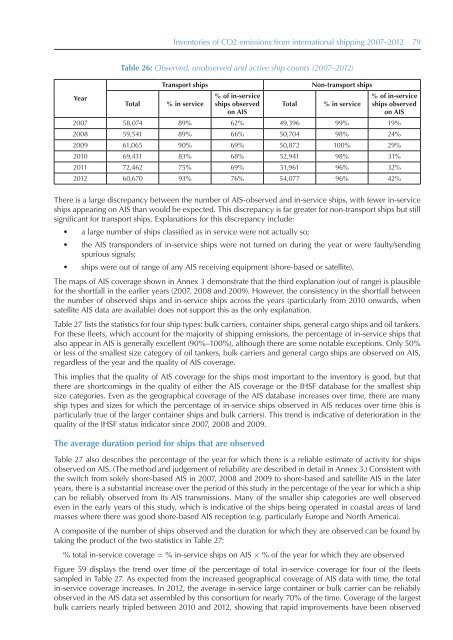
Table 26: Observed, unobserved and active ship counts (2007–2012)<br />
Total<br />
Transport ships<br />
% in service<br />
% of in-service<br />
ships observed<br />
on AIS<br />
Total<br />
Non-transport ships<br />
% in service<br />
% of in-service<br />
ships observed<br />
on AIS<br />
2007 58,074 89% 62% 49,396 99% 19%<br />
2008 59,541 89% 66% 50,704 98% 24%<br />
2009 61,065 90% 69% 50,872 100% 29%<br />
2010 69,431 83% 68% 52,941 98% 31%<br />
2011 72,462 75% 69% 51,961 96% 32%<br />
2012 60,670 93% 76% 54,077 96% 42%<br />
There is a large discrepancy between the number of AIS-observed and in-service ships, with fewer in-service<br />
ships appearing on AIS than would be expected. This discrepancy is far greater for non-transport ships but still<br />
significant for transport ships. Explanations for this discrepancy include:<br />
• a large number of ships classified as in service were not actually so;<br />
• the AIS transponders of in-service ships were not turned on during the year or were faulty/sending<br />
spurious signals;<br />
• ships were out of range of any AIS receiving equipment (shore-based or satellite).<br />
The maps of AIS coverage shown in Annex 3 demonstrate that the third explanation (out of range) is plausible<br />
for the shortfall in the earlier years (2007, 2008 and 2009). However, the consistency in the shortfall between<br />
the number of observed ships and in-service ships across the years (particularly from 2010 onwards, when<br />
satellite AIS data are available) does not support this as the only explanation.<br />
Table 27 lists the statistics for four ship types: bulk carriers, container ships, general cargo ships and oil tankers.<br />
For these fleets, which account for the majority of shipping emissions, the percentage of in-service ships that<br />
also appear in AIS is generally excellent (90%–100%), although there are some notable exceptions. Only 50%<br />
or less of the smallest size category of oil tankers, bulk carriers and general cargo ships are observed on AIS,<br />
regardless of the year and the quality of AIS coverage.<br />
This implies that the quality of AIS coverage for the ships most important to the inventory is good, but that<br />
there are shortcomings in the quality of either the AIS coverage or the IHSF database for the smallest ship<br />
size categories. Even as the geographical coverage of the AIS database increases over time, there are many<br />
ship types and sizes for which the percentage of in-service ships observed in AIS reduces over time (this is<br />
particularly true of the larger container ships and bulk carriers). This trend is indicative of deterioration in the<br />
quality of the IHSF status indicator since 2007, 2008 and 2009.<br />
The average duration period for ships that are observed<br />
Table 27 also describes the percentage of the year for which there is a reliable estimate of activity for ships<br />
observed on AIS. (The method and judgement of reliability are described in detail in Annex 3.) Consistent with<br />
the switch from solely shore-based AIS in 2007, 2008 and 2009 to shore-based and satellite AIS in the later<br />
years, there is a substantial increase over the period of this study in the percentage of the year for which a ship<br />
can be reliably observed from its AIS transmissions. Many of the smaller ship categories are well observed<br />
even in the early years of this study, which is indicative of the ships being operated in coastal areas of land<br />
masses where there was good shore-based AIS reception (e.g. particularly Europe and North America).<br />
A composite of the number of ships observed and the duration for which they are observed can be found by<br />
taking the product of the two statistics in Table 27:<br />
% total in-service coverage = % in-service ships on AIS × % of the year for which they are observed<br />
Figure 59 displays the trend over time of the percentage of total in-service coverage for four of the fleets<br />
sampled in Table 27. As expected from the increased geographical coverage of AIS data with time, the total<br />
in-service coverage increases. In 2012, the average in-service large container or bulk carrier can be reliabily<br />
observed in the AIS data set assembled by this consortium for nearly 70% of the time. Coverage of the largest<br />
bulk carriers nearly tripled between 2010 and 2012, showing that rapid improvements have been observed