- Page 1 and 2:
Third IMO Greenhouse Gas Study 2014
- Page 3 and 4:
Published in 2015 by the internatio
- Page 6 and 7:
Contents Page Preface .............
- Page 8 and 9:
vii 3.1.2 Outline .............
- Page 10:
ix Fleet productivity projectio
- Page 13 and 14:
xii Third IMO GHG Study 2014 The re
- Page 15 and 16:
xiv Third IMO GHG Study 2014 MEPC m
- Page 18 and 19:
List of figures Page Figure 1: Bott
- Page 20 and 21:
List of figures xix Page Figure 46:
- Page 22 and 23:
List of figures xxi Annex Figures P
- Page 24:
List of figures xxiii Figure 45: Ca
- Page 27 and 28:
xxvi Third IMO GHG Study 2014 Page
- Page 29 and 30:
xxviii Third IMO GHG Study 2014 Tab
- Page 32 and 33:
Executive Summary Key findings from
- Page 34 and 35:
Executive Summary 3 rigorous testin
- Page 36 and 37:
Executive Summary 5 emissions than
- Page 38 and 39:
Executive Summary 7 Figure 2 shows
- Page 40 and 41:
Executive Summary 9 because, in con
- Page 42 and 43:
Executive Summary 11 Particular car
- Page 44 and 45:
Executive Summary 13 larger ship si
- Page 46 and 47:
Executive Summary 15 Summary of Sec
- Page 48 and 49:
Executive Summary 17 a. CO 2 b. CH
- Page 50 and 51:
Executive Summary 19 Demand for coa
- Page 52 and 53:
Executive Summary 21 Figure 15 show
- Page 54 and 55:
Executive Summary 23 • ships obse
- Page 56 and 57:
Executive Summary 25 b Noon report
- Page 58 and 59:
1 Inventories of CO 2 emissions fro
- Page 60 and 61:
Inventories of CO2 emissions from i
- Page 62 and 63:
Inventories of CO2 emissions from i
- Page 64 and 65:
Inventories of CO2 emissions from i
- Page 66 and 67:
Inventories of CO2 emissions from i
- Page 68 and 69:
Inventories of CO2 emissions from i
- Page 70 and 71:
Inventories of CO2 emissions from i
- Page 72 and 73:
Inventories of CO2 emissions from i
- Page 74 and 75:
Inventories of CO2 emissions from i
- Page 76 and 77:
Inventories of CO2 emissions from i
- Page 78 and 79:
Inventories of CO2 emissions from i
- Page 80 and 81:
Inventories of CO2 emissions from i
- Page 82 and 83:
Inventories of CO2 emissions from i
- Page 84 and 85:
Inventories of CO2 emissions from i
- Page 86 and 87:
Inventories of CO2 emissions from i
- Page 88 and 89:
Inventories of CO2 emissions from i
- Page 90 and 91:
Inventories of CO2 emissions from i
- Page 92 and 93:
Inventories of CO2 emissions from i
- Page 94 and 95:
Inventories of CO2 emissions from i
- Page 96 and 97:
Inventories of CO2 emissions from i
- Page 98 and 99:
Inventories of CO2 emissions from i
- Page 100 and 101:
Inventories of CO2 emissions from i
- Page 102 and 103:
Inventories of CO2 emissions from i
- Page 104 and 105:
Inventories of CO2 emissions from i
- Page 106 and 107:
Inventories of CO2 emissions from i
- Page 108 and 109:
Inventories of CO2 emissions from i
- Page 110 and 111:
Inventories of CO2 emissions from i
- Page 112 and 113:
Inventories of CO2 emissions from i
- Page 114 and 115:
Inventories of CO2 emissions from i
- Page 116 and 117:
Inventories of CO2 emissions from i
- Page 118 and 119:
Inventories of CO2 emissions from i
- Page 120 and 121:
Inventories of CO2 emissions from i
- Page 122 and 123:
Inventories of CO2 emissions from i
- Page 124:
Inventories of CO2 emissions from i
- Page 127 and 128:
96 Third IMO GHG Study 2014 Emissio
- Page 129 and 130:
98 Third IMO GHG Study 2014 Method
- Page 131 and 132:
100 Third IMO GHG Study 2014 Table
- Page 133 and 134:
102 Third IMO GHG Study 2014 Year T
- Page 135 and 136:
104 Third IMO GHG Study 2014 2.2.7
- Page 137 and 138:
106 Third IMO GHG Study 2014 This s
- Page 139 and 140:
108 Third IMO GHG Study 2014 N 2 O
- Page 141 and 142:
110 Third IMO GHG Study 2014 Table
- Page 143 and 144:
112 Third IMO GHG Study 2014 Figure
- Page 145 and 146:
114 Third IMO GHG Study 2014 Table
- Page 147 and 148:
116 Third IMO GHG Study 2014 Table
- Page 149 and 150:
118 Third IMO GHG Study 2014 shippi
- Page 151 and 152:
120 Third IMO GHG Study 2014 • SO
- Page 153 and 154:
122 Third IMO GHG Study 2014 a) CO
- Page 155 and 156:
124 Third IMO GHG Study 2014 Table
- Page 158 and 159:
3 Scenarios for shipping emissions
- Page 160 and 161:
Scenarios for shipping emissions 20
- Page 162 and 163:
Scenarios for shipping emissions 20
- Page 164 and 165:
Scenarios for shipping emissions 20
- Page 166 and 167:
Scenarios for shipping emissions 20
- Page 168 and 169:
Scenarios for shipping emissions 20
- Page 170 and 171:
Scenarios for shipping emissions 20
- Page 172 and 173:
Scenarios for shipping emissions 20
- Page 174 and 175:
Scenarios for shipping emissions 20
- Page 176 and 177:
Scenarios for shipping emissions 20
- Page 178 and 179:
Bibliography for Main Report and An
- Page 180 and 181:
Bibliography for Main Report and An
- Page 182:
Bibliography for Main Report and An
- Page 185 and 186:
154 Third IMO GHG Study 2014 IHSF o
- Page 187 and 188:
156 Third IMO GHG Study 2014 Table
- Page 189 and 190:
158 Third IMO GHG Study 2014 Table
- Page 191 and 192:
160 Third IMO GHG Study 2014 Pre-pr
- Page 193 and 194:
162 Third IMO GHG Study 2014 There
- Page 195 and 196:
164 Third IMO GHG Study 2014 Follow
- Page 197 and 198:
166 Third IMO GHG Study 2014 Figure
- Page 199 and 200:
168 Third IMO GHG Study 2014 data s
- Page 201 and 202:
170 Third IMO GHG Study 2014 Table
- Page 203 and 204:
172 Third IMO GHG Study 2014 Ship c
- Page 205 and 206:
174 Third IMO GHG Study 2014 experi
- Page 207 and 208:
176 Third IMO GHG Study 2014 The mo
- Page 209 and 210:
178 Third IMO GHG Study 2014 sfc =
- Page 211 and 212:
180 Third IMO GHG Study 2014 2011 D
- Page 213 and 214: 182 Third IMO GHG Study 2014 Ship t
- Page 215 and 216: 184 Third IMO GHG Study 2014 Ship t
- Page 217 and 218: 186 Third IMO GHG Study 2014 2009 D
- Page 219 and 220: 188 Third IMO GHG Study 2014 Ship t
- Page 221 and 222: 190 Third IMO GHG Study 2014 Ship t
- Page 223 and 224: 192 Third IMO GHG Study 2014 2007 D
- Page 225 and 226: 194 Third IMO GHG Study 2014 Ship t
- Page 227 and 228: 196 Third IMO GHG Study 2014 Figure
- Page 229 and 230: 198 Third IMO GHG Study 2014 Figure
- Page 231 and 232: 200 Third IMO GHG Study 2014 Figure
- Page 233 and 234: 202 Third IMO GHG Study 2014 Every
- Page 235 and 236: 204 Third IMO GHG Study 2014 Figure
- Page 237 and 238: 206 Third IMO GHG Study 2014 Table
- Page 239 and 240: 208 Third IMO GHG Study 2014 time s
- Page 241 and 242: 210 Third IMO GHG Study 2014 2011
- Page 243 and 244: 212 Third IMO GHG Study 2014 2010
- Page 245 and 246: 214 Third IMO GHG Study 2014 2010
- Page 247 and 248: 216 Third IMO GHG Study 2014 2009
- Page 249 and 250: 218 Third IMO GHG Study 2014 2009
- Page 251 and 252: 220 Third IMO GHG Study 2014 2008
- Page 253 and 254: 222 Third IMO GHG Study 2014 2008
- Page 255 and 256: 224 Third IMO GHG Study 2014 2007
- Page 257 and 258: 226 Third IMO GHG Study 2014 2007
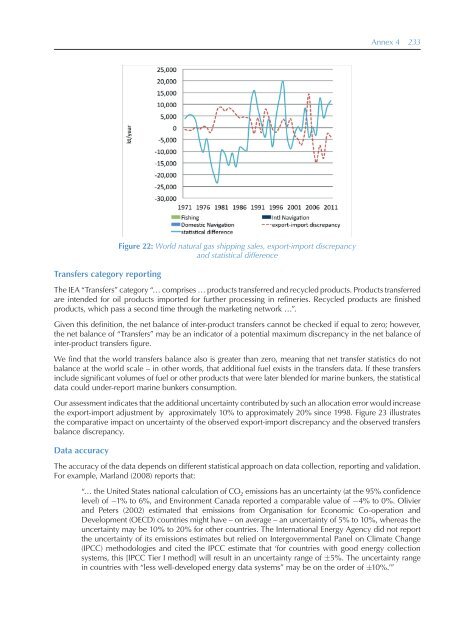
- Page 260 and 261: Annex 4 Details for Section 1.5.1:
- Page 262 and 263: Annex 4 231 IEA sources of uncertai
- Page 266 and 267: Annex 4 235 Figure 24: Time series
- Page 268 and 269: Annex 5 Details for Section 1.5.2:
- Page 270 and 271: Annex 5 239 3 The uncertainty in es
- Page 272 and 273: Annex 5 241 data has been used. The
- Page 274 and 275: Annex 5 243 temporal coverage QA/QC
- Page 276 and 277: Annex 5 245 uncertainties (standard
- Page 278 and 279: Annex 6 Details for Section 2: othe
- Page 280 and 281: Table 22 - Baseline emissions facto
- Page 282 and 283: Annex 6 251 Table 24 - EF-related S
- Page 284: Annex 6 253 Table 31 - PM FCFs - MG
- Page 287 and 288: 256 Third IMO GHG Study 2014 Analys
- Page 289 and 290: 258 Third IMO GHG Study 2014 Figure
- Page 291 and 292: 260 Third IMO GHG Study 2014 that s
- Page 293 and 294: 262 Third IMO GHG Study 2014 Contai
- Page 295 and 296: 264 Third IMO GHG Study 2014 Regard
- Page 297 and 298: 266 Third IMO GHG Study 2014 LNG ma
- Page 299 and 300: 268 Third IMO GHG Study 2014 • Th
- Page 301 and 302: 270 Third IMO GHG Study 2014 ULCCs
- Page 303 and 304: 272 Third IMO GHG Study 2014 Table
- Page 305 and 306: 274 Third IMO GHG Study 2014 potent
- Page 307 and 308: 276 Third IMO GHG Study 2014 Size c
- Page 309 and 310: 278 Third IMO GHG Study 2014 Table
- Page 311 and 312: 280 Third IMO GHG Study 2014 Year o
- Page 313 and 314: 282 Third IMO GHG Study 2014 Johnso
- Page 315 and 316:
284 Third IMO GHG Study 2014 The re
- Page 317 and 318:
286 Third IMO GHG Study 2014 MGO, t
- Page 319 and 320:
288 Third IMO GHG Study 2014 CH 4 M
- Page 321 and 322:
290 Third IMO GHG Study 2014 • As
- Page 323 and 324:
292 Third IMO GHG Study 2014 Table
- Page 325 and 326:
294 Third IMO GHG Study 2014 Table