MnrAq
MnrAq
MnrAq
Create successful ePaper yourself
Turn your PDF publications into a flip-book with our unique Google optimized e-Paper software.
vi Third IMO GHG Study 2014<br />
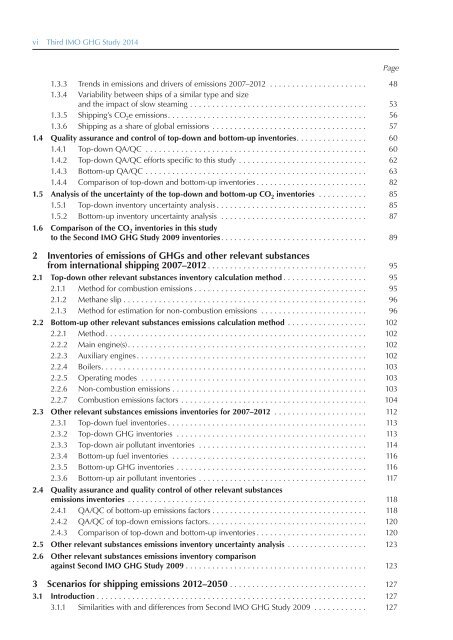
1.3.3 Trends in emissions and drivers of emissions 2007–2012 ...................... 48<br />
1.3.4 Variability between ships of a similar type and size<br />
and the impact of slow steaming ........................................ 53<br />
1.3.5 Shipping’s CO 2 e emissions. ............................................ 56<br />
1.3.6 Shipping as a share of global emissions ................................... 57<br />
1.4 Quality assurance and control of top-down and bottom-up inventories. ............... 60<br />
1.4.1 Top-down QA/QC .................................................. 60<br />
1.4.2 Top-down QA/QC efforts specific to this study ............................. 62<br />
1.4.3 Bottom-up QA/QC .................................................. 63<br />
1.4.4 Comparison of top-down and bottom-up inventories ......................... 82<br />
1.5 Analysis of the uncertainty of the top-down and bottom-up CO 2 inventories ........... 85<br />
1.5.1 Top-down inventory uncertainty analysis .................................. 85<br />
1.5.2 Bottom-up inventory uncertainty analysis ................................. 87<br />
1.6 Comparison of the CO 2 inventories in this study<br />
to the Second IMO GHG Study 2009 inventories. ................................ 89<br />
2 Inventories of emissions of GHGs and other relevant substances<br />
from international shipping 2007–2012 .................................... 95<br />
2.1 Top-down other relevant substances inventory calculation method ................... 95<br />
2.1.1 Method for combustion emissions ....................................... 95<br />
2.1.2 Methane slip ....................................................... 96<br />
2.1.3 Method for estimation for non-combustion emissions ........................ 96<br />
2.2 Bottom-up other relevant substances emissions calculation method .................. 102<br />
2.2.1 Method ........................................................... 102<br />
2.2.2 Main engine(s) ...................................................... 102<br />
2.2.3 Auxiliary engines .................................................... 102<br />
2.2.4 Boilers. ........................................................... 103<br />
2.2.5 Operating modes ................................................... 103<br />
2.2.6 Non-combustion emissions . . . . . . . . . . . . . . . . . . . . . . . . . . . . . . . . . . . . . . . . . . . . 103<br />
2.2.7 Combustion emissions factors .......................................... 104<br />
2.3 Other relevant substances emissions inventories for 2007–2012 ..................... 112<br />
2.3.1 Top-down fuel inventories ............................................. 113<br />
2.3.2 Top-down GHG inventories ........................................... 113<br />
2.3.3 Top-down air pollutant inventories ...................................... 114<br />
2.3.4 Bottom-up fuel inventories ............................................ 116<br />
2.3.5 Bottom-up GHG inventories ........................................... 116<br />
2.3.6 Bottom-up air pollutant inventories ...................................... 117<br />
2.4 Quality assurance and quality control of other relevant substances<br />
emissions inventories ...................................................... 118<br />
2.4.1 QA/QC of bottom-up emissions factors ................................... 118<br />
2.4.2 QA/QC of top-down emissions factors. ................................... 120<br />
2.4.3 Comparison of top-down and bottom-up inventories ......................... 120<br />
2.5 Other relevant substances emissions inventory uncertainty analysis .................. 123<br />
2.6 Other relevant substances emissions inventory comparison<br />
against Second IMO GHG Study 2009 ......................................... 123<br />
3 Scenarios for shipping emissions 2012–2050 ............................... 127<br />
3.1 Introduction ............................................................. 127<br />
3.1.1 Similarities with and differences from Second IMO GHG Study 2009 ............ 127<br />
Page


