Radiography in Modern Industry - Kodak
Radiography in Modern Industry - Kodak
Radiography in Modern Industry - Kodak

Create successful ePaper yourself
Turn your PDF publications into a flip-book with our unique Google optimized e-Paper software.
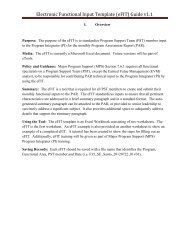
DiscussionDensitometric data and process control charts for one expos<strong>in</strong>g unit and one processor arepresented as Figures 79 to 80. The process density aim (the mean density) and the upper andlower control limits on the charts (the table immediately above and the one below) werecomputed from the densitometric data for the 10-day period shown <strong>in</strong> Figure 79. As stated earlier,the control limits on both charts are wider than would be the case if either the expos<strong>in</strong>g unit or theprocessor were monitored <strong>in</strong>dividually. Although two control charts are illustrated, they can becomb<strong>in</strong>ed <strong>in</strong>to one for convenience.Exposure and Process<strong>in</strong>g VariationsVariations <strong>in</strong> both exposure and process<strong>in</strong>g are reflected on the process control chart reproducedas Figure 80. All the high-density read<strong>in</strong>gs are plotted, but only the read<strong>in</strong>gs from control stripsexposed at the same time are connected. The l<strong>in</strong>es represent the day-to-day repeatability of filmprocess<strong>in</strong>g, the difference between the po<strong>in</strong>t plots on a given day represents the repeatability ofexposure.Figure 81: Control chart for one expos<strong>in</strong>g unit and one processor <strong>in</strong>dicat<strong>in</strong>g changes <strong>in</strong>contrast. Plot the difference between the high-density read<strong>in</strong>g and the low-density read<strong>in</strong>gof the fresh-image control strips, and connect the plots. A decrease <strong>in</strong> density differencefrom the process density aim, or the mean density, <strong>in</strong>dicates lower contrast; an <strong>in</strong>crease<strong>in</strong>dicates higher density.Process Control Chart--Changes <strong>in</strong> Film ContrastMon. Tues. Wed. Thurs. Fri. Sat. Sun. Mon. Tues. Wed. Thurs. Fri.UppercontrollimitProcessdensityaimLowercontrollimit1.301.100.90There will be a slight density loss of the latent image on the control strips processed one to threedays after exposure even though they are refrigerated. However, this small difference <strong>in</strong> densityis no cause for concern with the type of control chart shown <strong>in</strong> Figure 80. If the density of therefrigerated control strip is always slightly lower (0.03 to 0.04) than that of its correspond<strong>in</strong>g freshcontrol strip, the process is repeat<strong>in</strong>g identically.Contrast VariationsVariations <strong>in</strong> film contrast are reflected on the control chart reproduced as Figure 81. Thedifference between the high-density read<strong>in</strong>g and the low-density read<strong>in</strong>g of the fresh-imagecontrol strips is plotted on this chart. (Latent-image control strips serve equally well fordeterm<strong>in</strong><strong>in</strong>g density difference.) A decrease <strong>in</strong> density difference from the mean density, or theprocess density aim, <strong>in</strong>dicates lower contrast, an <strong>in</strong>crease <strong>in</strong> density difference <strong>in</strong>dicates highercontrast.<strong>Radiography</strong> <strong>in</strong> <strong>Modern</strong> <strong>Industry</strong> 127