Radiography in Modern Industry - Kodak
Radiography in Modern Industry - Kodak
Radiography in Modern Industry - Kodak

Create successful ePaper yourself
Turn your PDF publications into a flip-book with our unique Google optimized e-Paper software.
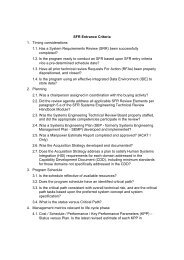
Figure 44: Typical exposure chart for steel. This chart may be taken to apply to Film X (forexample), with lead foil screens, at a film density of 1.5. Source-film distance, 40 <strong>in</strong>ches.Exposure charts are usually available from manufacturers of x-ray equipment. Because, <strong>in</strong>general, such charts cannot be used for different x-ray mach<strong>in</strong>es unless suitable correctionfactors are applied, <strong>in</strong>dividual laboratories sometimes prepare their own.Prepar<strong>in</strong>g An Exposure ChartA simple method for prepar<strong>in</strong>g an exposure chart is to make a series of radiographs of a pile ofplates consist<strong>in</strong>g of a number of steps. This "step tablet" or stepped wedge, is radiographed atseveral different exposure times at each of a number of kilovoltages. The exposed films are allprocessed under conditions identical to those that will later be used for rout<strong>in</strong>e work. Eachradiograph consists of a series of photographic densities correspond<strong>in</strong>g to the x-ray <strong>in</strong>tensitiestransmitted by the different thicknesses of metal. A certa<strong>in</strong> density, for example, 1.5, is selectedas the basis for the preparation of the chart. Wherever this density occurs on the stepped-wedgeradiographs, there are correspond<strong>in</strong>g values of thickness, milliampere-m<strong>in</strong>utes, and kilovoltage. Itis unlikely that many of the radiographs will conta<strong>in</strong> a value of exactly 1.5 <strong>in</strong> density, but thecorrect thickness for this density can be found by <strong>in</strong>terpolation between steps. Thickness andmilliampere-m<strong>in</strong>ute values are plotted for the different kilovoltages <strong>in</strong> the manner shown <strong>in</strong> Figure44.Another method, requir<strong>in</strong>g fewer stepped wedge exposures but more arithmetical manipulation, isto make one step-tablet exposure at each kilovoltage and to measure the densities <strong>in</strong> theprocessed stepped-wedge radiographs. The exposure that would have given the chosen density(<strong>in</strong> this case 1.5) under any particular thickness of the stepped wedge can then be determ<strong>in</strong>edfrom the characteristic curve of the film used (See "The Characteristic Curve"). The values forthickness, kilovoltage, and exposure are plotted as described <strong>in</strong> the figure above.Note that thickness is on a l<strong>in</strong>ear scale, and that milliampere-m<strong>in</strong>utes are on a logarithmic scale.The logarithmic scale is not necessary, but it is very convenient because it compresses anotherwise long scale. A further advantage of the logarithmic exposure scale is that it usuallyallows the location of the po<strong>in</strong>ts for any one kilovoltage to be well approximated by a straight l<strong>in</strong>e.<strong>Radiography</strong> <strong>in</strong> <strong>Modern</strong> <strong>Industry</strong> 66