Radiography in Modern Industry - Kodak
Radiography in Modern Industry - Kodak
Radiography in Modern Industry - Kodak

You also want an ePaper? Increase the reach of your titles
YUMPU automatically turns print PDFs into web optimized ePapers that Google loves.
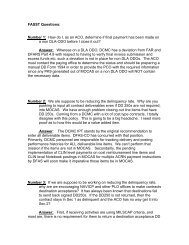
Figure 61: Abridged form of the exposure chart derived from a previous figure, butshow<strong>in</strong>g exposures at 180 kV to produce a density of 1.0 on Film X. Dotted l<strong>in</strong>es <strong>in</strong>dicatethe metal thickness correspond<strong>in</strong>g to the log E <strong>in</strong>terval of the figure above. If theseparation of l<strong>in</strong>es ABC and DEF is ma<strong>in</strong>ta<strong>in</strong>ed, they can be moved up and down the chart.They will then mark off a large number of thickness ranges on the various kilovoltagel<strong>in</strong>es, all of which will completely fill the density range which has been assumed to beuseful.A simple means for apply<strong>in</strong>g this method to rout<strong>in</strong>e work is as follows:Parallel l<strong>in</strong>es are drawn on a transparent plastic sheet, such as a fixed-out x-ray film, <strong>in</strong> themanner shown <strong>in</strong> the figure below. The spac<strong>in</strong>g between the base l<strong>in</strong>e and the l<strong>in</strong>e immediatelyabove is the log relative exposure <strong>in</strong>terval for Film X between D = 1.0 and D = 3.5. It is laid off tothe same scale as the ord<strong>in</strong>ate (vertical) scale of the exposure chart. Similarly, the distance fromthe basel<strong>in</strong>e to any other l<strong>in</strong>e parallel to it can be made to correspond to the log relative exposure<strong>in</strong>terval for other density limits and films. This transparent guide is moved up and down on theexposure chart with its l<strong>in</strong>es parallel to the thickness axis. The two guidel<strong>in</strong>es be<strong>in</strong>g used form arectangle with the two vertical l<strong>in</strong>es of the exposure chart that mark the thickness limits of thespecimen. The correct kilovoltage is the one whose graph <strong>in</strong>tersects diagonally opposite comersof the rectangle. If the film type used is the one for which the chart was prepared, the correctexposure is <strong>in</strong>dicated at the <strong>in</strong>tersection of the upper guide l<strong>in</strong>e with the exposure scale (Po<strong>in</strong>t CFigure 1). If a different film is used, a suitable correction factor obta<strong>in</strong>ed either from tables ofrelative speeds or by the method described <strong>in</strong> Example 2 <strong>in</strong> "Overlay Methods" and "NomogramMethods", must be applied to the exposure as determ<strong>in</strong>ed from the chart.<strong>Radiography</strong> <strong>in</strong> <strong>Modern</strong> <strong>Industry</strong> 84