Radiography in Modern Industry - Kodak
Radiography in Modern Industry - Kodak
Radiography in Modern Industry - Kodak

Create successful ePaper yourself
Turn your PDF publications into a flip-book with our unique Google optimized e-Paper software.
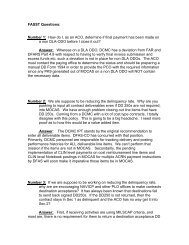
Figure 62: System of l<strong>in</strong>es drawn on a transparent sheet to be used <strong>in</strong> connection with anexposure chart for estimat<strong>in</strong>g radiographic exposures for multithickness specimens.If there is only one graph on a gamma-ray exposure chart, this procedure will <strong>in</strong>dicate limit<strong>in</strong>gthicknesses of material that can be radiographed with<strong>in</strong> the prescribed density limits.On a chart of the type Figure 46, which has l<strong>in</strong>es for various densities, the thickness range thatcan be radiographed <strong>in</strong> a s<strong>in</strong>gle exposure can be read directly. For example, the same exposure(exposure factor = 0.7) will give a density of 1.5 through 2 <strong>in</strong>ches of steel and a density of 2.5through about 11/2 <strong>in</strong>ches of steel.Use Of Multiple FilmsIf the chart shows that the thickness range is too great for a s<strong>in</strong>gle exposure under any condition,it may be used to select two different exposures to cover the range. Another technique is to loadthe cassette with two films of different speed and expose them simultaneously, <strong>in</strong> which case thechart may be used to select the exposure. The log relative exposure range for two films ofdifferent speed, when used together <strong>in</strong> this manner, is the difference <strong>in</strong> log exposure between thevalue at the low-density end of the faster film curve and the high-density end of the slower filmcurve. Figure 47 shows that when Films X and Y are used, the difference is 1.22, which is thedifference between 1.57 and 2.79. It is necessary that the films be close enough together <strong>in</strong>speed so that their curves will have some "overlap" on the log E axis.Limitations Of Exposure ChartsAlthough exposure charts are useful <strong>in</strong>dustrial radiographic tools, they must be used with somecaution. They will, <strong>in</strong> most cases, be adequate for rout<strong>in</strong>e practice, but they will not always showthe precise exposure required to radiograph a given thickness to a particular density.Several factors have a direct <strong>in</strong>fluence on the accuracy with which exposures can be predicted.Exposure charts are ord<strong>in</strong>arily prepared by radiograph<strong>in</strong>g a stepped wedge. S<strong>in</strong>ce the proportionof scattered radiation depends on the thickness of material and, therefore, on the distribution ofthe material <strong>in</strong> a given specimen, there is no assurance that the scattered radiation underdifferent parts will correspond to the amount under the same thickness of the wedge. In fact, it isunreasonable to expect exact correspondence between scatter<strong>in</strong>g conditions under two objectsthe thicknesses of which are the same but <strong>in</strong> which the distribution of material is quite different.The more closely the distribution of metal <strong>in</strong> the wedge resembles that <strong>in</strong> the specimen the moreaccurately the exposure chart will serve its purpose. For example, a narrow wedge wouldapproximate the scatter<strong>in</strong>g conditions for specimens conta<strong>in</strong><strong>in</strong>g narrow bars.<strong>Radiography</strong> <strong>in</strong> <strong>Modern</strong> <strong>Industry</strong> 85