Radiography in Modern Industry - Kodak
Radiography in Modern Industry - Kodak
Radiography in Modern Industry - Kodak

You also want an ePaper? Increase the reach of your titles
YUMPU automatically turns print PDFs into web optimized ePapers that Google loves.
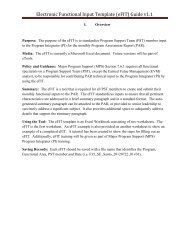
To illustrate, let us assume that the image of the bottom marker (M 2 ) on a specimen 2 <strong>in</strong>chesthick moved 1/16 <strong>in</strong>ch and that of the top marker (M 1 ) moved 1/4 <strong>in</strong>ch. A graph similar to that <strong>in</strong>the figure below is drawn, with image shift on the horizontal axis and specimen thickness on thevertical. Po<strong>in</strong>ts M 1 and M 2 are plotted at the appropriate image shift and thickness values, and astraight l<strong>in</strong>e is drawn between them. (Note that for convenience <strong>in</strong> plott<strong>in</strong>g, 0 specimen thicknessis considered to be on the film side of the specimen.) If the image of a discont<strong>in</strong>uity has shifted,for example, 3/16 <strong>in</strong>ch, its distance from the film side of the specimen--15/16 <strong>in</strong>ch--can be readdirectly from the graph as shown <strong>in</strong> the dashed l<strong>in</strong>e of Figure 94. It should be emphasized thatFigure 94 is not a general curve, but is for illustration of the method only. A graph of the sametype must be drawn for each particular set of circumstances.Note that <strong>in</strong> this method it is not necessary to know either source-film distance or amount of tubeshift. This often makes the method convenient even <strong>in</strong> those cases where the image of thebottom marker (M 2 ) shifts only imperceptibly. The po<strong>in</strong>t (M 2 ) of Figure 94 then co<strong>in</strong>cides with theorig<strong>in</strong> of the graph.Figure 94: Example of the graphical method for localiz<strong>in</strong>g a discont<strong>in</strong>uity by the parallax(double-exposure) technique.Thickness MeasurementOccasionally, it is necessary to measure the thickness of a material <strong>in</strong> a location where it isdifficult or impossible to use gauges, calipers, or the like. In these cases, radiography cansometimes be applied. One example of this would be the measurement of the wall thickness of ahollow air-craft-propeller blade.The technique is simple, <strong>in</strong>volv<strong>in</strong>g the simultaneous radiography of the item <strong>in</strong> question and astepped wedge of the same material. The stepped wedge should be wide or, if narrow, should bemasked with lead <strong>in</strong> order to avoid difficulties and errors due to the undercut of scattered radiation<strong>in</strong>to the area of the stepped wedge. The stepped wedge should be placed as close as possible tothe area to be measured to avoid errors from differences <strong>in</strong> radiation <strong>in</strong>tensity across the field.Ideally, the stepped wedge and the specimen should be radiographed on the same film. If this isnot possible, as for <strong>in</strong>stance when a film is <strong>in</strong>serted <strong>in</strong>to a hollow propeller blade, the steppedwedge should be radiographed on film from the same box. Care should be taken that the screensused to radiograph specimen and wedge are the same. If separate films are used for wedge andspecimen, they should be processed together. These precautions avoid errors caused bydifferences <strong>in</strong> x-ray exposure and errors <strong>in</strong> process<strong>in</strong>g.A curve is drawn relat<strong>in</strong>g thickness of the stepped wedge to the density obta<strong>in</strong>ed. Thicknesses <strong>in</strong>the part under test are then determ<strong>in</strong>ed by reference to this curve. Plott<strong>in</strong>g a calibration curve for<strong>Radiography</strong> <strong>in</strong> <strong>Modern</strong> <strong>Industry</strong> 153