Radiography in Modern Industry - Kodak
Radiography in Modern Industry - Kodak
Radiography in Modern Industry - Kodak

Create successful ePaper yourself
Turn your PDF publications into a flip-book with our unique Google optimized e-Paper software.
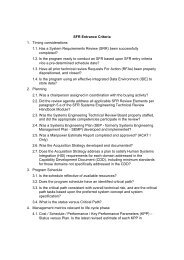
Figure 58: Overlay positioned so as to make the exposure chart and the nomogram applyto Film Y rather than to Film X. See No. 3, "Film type", above.4. Changes <strong>in</strong> process<strong>in</strong>g conditions. It is difficult to make simple corrections for gross changes <strong>in</strong>process<strong>in</strong>g conditions, because such changes affect both the speed and the contrast of the film,often to a marked degree (See "Effect Of Development Time On Speed And Contrast").For the sake of both economy and radiographic quality, avoid large departures fromrecommended times and temperatures.However, <strong>in</strong> manual process<strong>in</strong>g of some <strong>in</strong>dustrial x-ray films, the development time may be<strong>in</strong>creased, for example, from 5 to 8 m<strong>in</strong>utes at 68° F. The longer development may result <strong>in</strong>speed <strong>in</strong>creases that are frequently useful <strong>in</strong> practice, with little or no change <strong>in</strong> the shape of thecharacteristic curve--that is, with little or no change <strong>in</strong> film contrast. Exposure charts andnomograms of the types shown earlier can be made to apply to both development times.Assume, for <strong>in</strong>stance, that <strong>in</strong>creas<strong>in</strong>g the development time of Film X from 5 to 8 m<strong>in</strong>utes at 68° Fresults <strong>in</strong> a 20 percent ga<strong>in</strong> <strong>in</strong> speed. The ratio of exposures required to achieve the same densitywould be 1:1.2. The logarithm of 1.2 is 0.08. A mark at log E <strong>in</strong>terval of 0.08 above the arrowpr<strong>in</strong>ted on the exposure chart would allow the overlay to be positioned so that exposures for adevelopment time of 8 m<strong>in</strong>utes could be read directly.5. Film density. Exposure charts apply only to a s<strong>in</strong>gle density of the processed radiograph.However, by the use of data from the characteristic curve of the film, it is possible to supply aslid<strong>in</strong>g scale that can make the exposure chart applicable to any densities desired.Figure 44 was drawn for a density of 1.5. Let us assume that it is desired to make this chartapplicable to densities of 1.0, 2.0, and 3.0 also. The second column of the tabulation below isobta<strong>in</strong>ed from the characteristic curve of Film X <strong>in</strong> Figure 47.<strong>Radiography</strong> <strong>in</strong> <strong>Modern</strong> <strong>Industry</strong> 81