Financial resultsManagement <strong>report</strong>Consolidatedfinancial statementsAdditional information <strong>Annual</strong> financial statementsCONSOLIDATED BALANCE SHEET(in millions of EUR) 31/12/09 31/12/10TOTAL ASSETS 577,630 566,735Cash and balances with central banks 2,673 3,266Loans and advances due from banks 47,427 53,379Loans and advances to customers 353,987 352,307Financial assets measured at fair value through profit or loss 10,077 9,288Financial investments 105,251 87,367Derivatives 40,728 47,077Fair value revaluation of portfolio hedge 3,579 4,003Investments in associates 171 171Tangible fixed assets 2,396 2,346Intangible assets and goodwill 2,177 2,276Tax assets 2,919 2,847Other assets 1,895 2,358Non current assets held for sale 4,350 50TOTAL LIABILITIES AND EQUITY 577,630 566,735Due to banks 123,724 98,490Customer borrowings and deposits 120,950 127,060Financial liabilities measured at fair value through profit or loss 19,345 20,154Derivatives 58,364 72,347Fair value revaluation of portfolio hedge 1,939 1,979Debt securities 213,065 210,473Subordinated debts 4,111 3,904Technical provisions of insurance <strong>com</strong>panies 13,408 15,646Provisions and other obligations 1,581 1,498Tax liabilities 238 157Other liabilities 4,585 4,299Liabilities included in disposal groups held for sale 4,332 0Total liabilities 565,642 556,007Subscribed capital 8,089 8,442Additional paid-in capital 13,618 13,618Treasury shares (25) (21)Reserves and retained earnings (4,194) (3,548)Net in<strong>com</strong>e for the period 1,010 723Core shareholders’ equity 18,498 19,214Gains and losses not recognised in the statement of in<strong>com</strong>e (8,317) (10,269)Total shareholders’ equity 10,181 8,945Non-controlling interests 1,806 1,783Discretionary participation features of insurance contracts 1 0Total equity 11,988 10,728AssetsLoans and advances to customers were reduced byEUR 1.6 billion (-0.5%) in <strong>2010</strong> and stood at EUR 352 billionat the end of the year. This is the result of a EUR 8 billiondecrease due to the balance-sheet deleveraging processand the natural amortization while loans and advances tocustomers increased by EUR 6 billion (mainly in the Retail andCommercial Banking activities in Belgium and Turkey).Financial assets at fair value through profit and lossdecreased by EUR 0.8 billion (-8%) at EUR 9.3 billion.Loans and advances due from banks increased toEUR 53 billion, i.e. a EUR 6 billion positive variation as<strong>com</strong>pared to December 2009. This was mainly due to reverserepurchase agreements (EUR +3 billion), cash collateral posted(EUR +6 billion) and loans and advances (EUR -2 billion).Cash and balances with central banks stood atEUR 3.3 billion.Financial investments, which include available-for-saleassets, declined to EUR 87.4 billion (-17%) because of thebalance-sheet deleveraging process.102<strong>Dexia</strong> <strong>Annual</strong> <strong>report</strong> <strong>2010</strong>
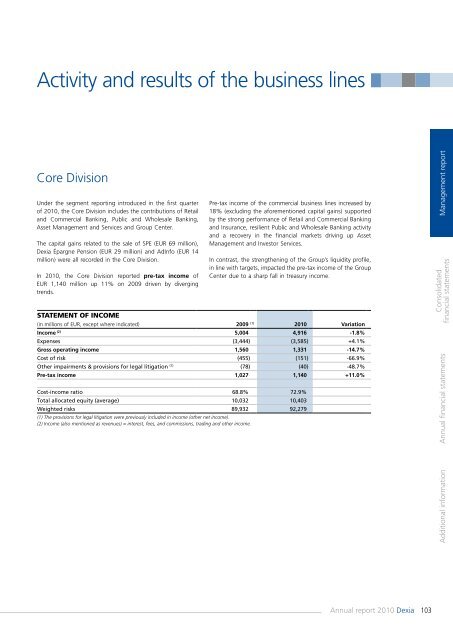
Activity and results of the business linesCore DivisionUnder the segment <strong>report</strong>ing introduced in the first quarterof <strong>2010</strong>, the Core Division includes the contributions of Retailand Commercial Banking, Public and Wholesale Banking,Asset Management and Services and Group Center.The capital gains related to the sale of SPE (EUR 69 million),<strong>Dexia</strong> Épargne Pension (EUR 29 million) and AdInfo (EUR 14million) were all recorded in the Core Division.In <strong>2010</strong>, the Core Division <strong>report</strong>ed pre-tax in<strong>com</strong>e ofEUR 1,140 million up 11% on 2009 driven by divergingtrends.Pre-tax in<strong>com</strong>e of the <strong>com</strong>mercial business lines increased by18% (excluding the aforementioned capital gains) supportedby the strong performance of Retail and Commercial Bankingand Insurance, resilient Public and Wholesale Banking activityand a recovery in the financial markets driving up AssetManagement and Investor Services.In contrast, the strengthening of the Group’s liquidity profile,in line with targets, impacted the pre-tax in<strong>com</strong>e of the GroupCenter due to a sharp fall in treasury in<strong>com</strong>e.Statement of in<strong>com</strong>e(in millions of EUR, except where indicated) 2009 (1) <strong>2010</strong> VariationIn<strong>com</strong>e (2) 5,004 4,916 -1.8%Expenses (3,444) (3,585) +4.1%Gross operating in<strong>com</strong>e 1,560 1,331 -14.7%Cost of risk (455) (151) -66.9%Other impairments & provisions for legal litigation (1) (78) (40) -48.7%Pre-tax in<strong>com</strong>e 1,027 1,140 +11.0%Cost-in<strong>com</strong>e ratio 68.8% 72.9%Total allocated equity (average) 10,032 10,403Weighted risks 89,932 92,279(1) The provisions for legal litigation were previously included in in<strong>com</strong>e (other net in<strong>com</strong>e).(2) In<strong>com</strong>e (also mentioned as revenues) = interest, fees, and <strong>com</strong>missions, trading and other in<strong>com</strong>e.Management <strong>report</strong>Consolidatedfinancial statementsAdditional information <strong>Annual</strong> financial statements<strong>Annual</strong> <strong>report</strong> <strong>2010</strong> <strong>Dexia</strong>103