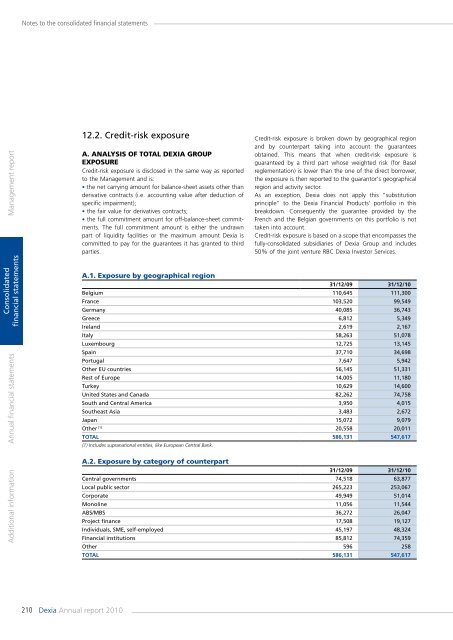
Notes to the consolidated financial statementsManagement <strong>report</strong>12.2. Credit-risk exposureA. Analysis of total <strong>Dexia</strong> GroupexposureCredit-risk exposure is disclosed in the same way as <strong>report</strong>edto the Management and is:• the net carrying amount for balance-sheet assets other thanderivative contracts (i.e. accounting value after deduction ofspecific impairment);• the fair value for derivatives contracts;• the full <strong>com</strong>mitment amount for off-balance-sheet <strong>com</strong>mitments.The full <strong>com</strong>mitment amount is either the undrawnpart of liquidity facilities or the maximum amount <strong>Dexia</strong> is<strong>com</strong>mitted to pay for the guarantees it has granted to thirdparties.Credit-risk exposure is broken down by geographical regionand by counterpart taking into account the guaranteesobtained. This means that when credit-risk exposure isguaranteed by a third part whose weighted risk (for Baselreglementation) is lower than the one of the direct borrower,the exposure is then <strong>report</strong>ed to the guarantor's geographicalregion and activity sector.As an exception, <strong>Dexia</strong> does not apply this “substitutionprinciple“ to the <strong>Dexia</strong> Financial Products' portfolio in thisbreakdown. Consequently the guarantee provided by theFrench and the Belgian governments on this portfolio is nottaken into account.Credit-risk exposure is based on a scope that en<strong>com</strong>passes thefully-consolidated subsidiaries of <strong>Dexia</strong> Group and includes50% of the joint venture RBC <strong>Dexia</strong> Investor Services.Consolidatedfinancial statementsAdditional information <strong>Annual</strong> financial statementsA.1. Exposure by geographical region31/12/09 31/12/10Belgium 110,645 111,300France 103,520 99,549Germany 40,085 36,743Greece 6,812 5,349Ireland 2,619 2,167Italy 58,263 51,078Luxembourg 12,725 13,145Spain 37,710 34,698Portugal 7,647 5,942Other EU countries 56,145 51,331Rest of Europe 14,005 11,180Turkey 10,629 14,600United States and Canada 82,262 74,758South and Central America 3,950 4,015Southeast Asia 3,483 2,672Japan 15,072 9,079Other (1) 20,558 20,011Total 586,131 547,617(1) Includes supranational entities, like European Central Bank.A.2. Exposure by category of counterpart31/12/09 31/12/10Central governments 74,518 63,877Local public sector 265,223 253,067Corporate 49,949 51,014Monoline 11,056 11,544ABS/MBS 36,272 26,047Project finance 17,508 19,127Individuals, SME, self-employed 45,197 48,324Financial institutions 85,812 74,359Other 596 258Total 586,131 547,617210 <strong>Dexia</strong> <strong>Annual</strong> <strong>report</strong> <strong>2010</strong>
Notes to the consolidated financial statementsA.3. Credit quality of <strong>Dexia</strong> FinancialProducts' financial assetsA.3.1. History and nature of the portfolioOn 14 November 2008, <strong>Dexia</strong> entered into a sale andpurchase agreement with Assured Guaranty (Assured)relating to the sale of Financial Security Assurance HoldingsLtd (hereafter FSA Insurance), excluding its Financial Productsactivity (hereafter <strong>Dexia</strong> FP).The <strong>Dexia</strong> FP activity consisted, in substance, in (i) takingdeposits from third parties (in general from issuers – localauthorities or ABS issuers of instruments which whereenhanced by FSA Inc.) in favor of whom <strong>Dexia</strong> FP undertakesto remunerate such deposits at a determined level, pursuantto Guaranteed Investment Contracts, (“GICs”) and (ii)the reinvestment of these deposits, with the objective ofgenerating a net positive interest rate margin.Even though its initial rating was mostly AAA, <strong>Dexia</strong> FP’s assetportfolio includes a substantial proportion of instrumentsdirectly or indirectly linked to the American real-estate sectorwith a rating and/or a market value that have significantlydeteriorated because of the sub-prime crisis and the globalfinancial crisis.A.3.2. Consequences of the exclusion of the FPand States’ guaranteeThe FP activity was excluded from the sale to Assured.However, to the extent that FSA Inc. (the former subsidiaryof FSAH, renamed Assured Guaranty Municipal Holdings Inc.which provides, directly or through its subsidiaries, the creditenhancement activities of the Group) guarantees assets andliabilities of the FP activity, the exclusions of this activity fromthe scope of the sale necessarily means that the <strong>Dexia</strong> Groupmust guarantee the FP activities, so that guarantees given byFSA Inc. are not called upon. Given the financial situation ofthe <strong>Dexia</strong> Group, and to the maximum theoretical amountof the guarantee given by <strong>Dexia</strong>, it was considered vital bythe purchaser, that <strong>Dexia</strong> be itself guaranteed by the Belgianand French States. The share sale agreement entered intowith Assured therefore stipulated as a condition to the salethat either <strong>Dexia</strong> should post collateral (e.g. cash securities oreligible instruments), but in excessive proportions, at the timeof the signature of the agreement, or that a state guaranteeshould be given.The Belgian and French States consented to giving thisguarantee, and agreed with <strong>Dexia</strong>, under certain conditions,that their recourse against <strong>Dexia</strong> under this guarantee wouldbe converted into <strong>Dexia</strong> shares. That conversion right isorganized through the subscription rights.For a more detailed description of the guarantee, we referto the note 9.4.C. to the consolidated financial statements,Related parties transactions – Transactions with the Belgian,French and Luxembourg StatesThe main conditions of the Guarantee Agreement and theGuarantee Reimbursement Agreement are, in substance, thefollowing:• <strong>Dexia</strong> FP put. <strong>Dexia</strong> SA and <strong>Dexia</strong> Crédit Local SA (“DCL”)(<strong>Dexia</strong> and DCL are hereafter referred to as the “<strong>Dexia</strong>Guarantors”) entered into a put agreement whereby <strong>Dexia</strong> FPis entitled to sell to <strong>Dexia</strong> and/or DCL certain assets includedin the <strong>Dexia</strong> FP portfolio existing at the signature of theguarantee upon the occurrence of certain trigger events.• States’ guarantee. The Belgian and French States eachundertook to guarantee, severally and not jointly, theobligations of <strong>Dexia</strong> SA pursuant to the put agreement up toan amount equal to USD 16.98 billion and up to 62.3711%for the Belgian State and 37.6289% for the French State.• Guaranteed portfolio. The portfolio to which this putrelates is the <strong>Dexia</strong> FP portfolio after deduction of the“excluded assets” for a nominal amount of USD 4.5 billion,to the effect that the par value of the assets included in theportfolio to which the put relates is equal to USD 9.7 billionon 31 December <strong>2010</strong>. The excluded assets are subject toa put contract between the <strong>Dexia</strong> Guarantors on the onehand and <strong>Dexia</strong> FP on the other, but the obligations of <strong>Dexia</strong>pursuant to this second put contract are not guaranteed bythe States.• Trigger events. <strong>Dexia</strong> FP has undertaken vis-à-vis Assuredto exercise the put in certain situations in order to assure theeffectiveness of the protection mechanism. These differentsituations are:(i) an asset default, i.e. a failure to pay the principal or theinterest due on the assets of the portfolio at the final maturity;in this case the put relates to those assets and the assets aresold to the <strong>Dexia</strong> Guarantors at their residual par value (i.e.face value) increased by the amount of interest due.(ii) a liquidity default, i.e. a failure by <strong>Dexia</strong> (at any date priorto 31 October 2011) to <strong>com</strong>ply with its obligations pursuantto the liquidity agreement entered into or to be entered intoin favor of <strong>Dexia</strong> FP; in this case the put relates to a numberof assets whose residual par value is equal to the amountof the liquidity default, and the assets will be sold to the<strong>Dexia</strong> Guarantors at their residual par value increased by theamount of interest due.(iii) a collateral default, i.e. a failure by <strong>Dexia</strong> to provide,between 29 September and 31 October 2011, collateral to<strong>Dexia</strong> FP in an amount equal to the difference between theamount of the liabilities pursuant to the GICs and the marketvalue of the assets of <strong>Dexia</strong> FP after applying a haircut tothese assets; in this case, the put relates to a number ofassets whose residual par value is equal to the amount ofthe collateral default and the assets are sold to <strong>Dexia</strong> at theirresidual par value increased by the amount of interest due.(iv) an insolvency of <strong>Dexia</strong> (a defined in the GuaranteeAgreement) in which case the put relates to all the assetsManagement <strong>report</strong>Consolidatedfinancial statementsAdditional information <strong>Annual</strong> financial statements<strong>Annual</strong> <strong>report</strong> <strong>2010</strong> <strong>Dexia</strong>211