Annual report 2010 - Dexia.com
Annual report 2010 - Dexia.com
Annual report 2010 - Dexia.com
- No tags were found...

Create successful ePaper yourself
Turn your PDF publications into a flip-book with our unique Google optimized e-Paper software.
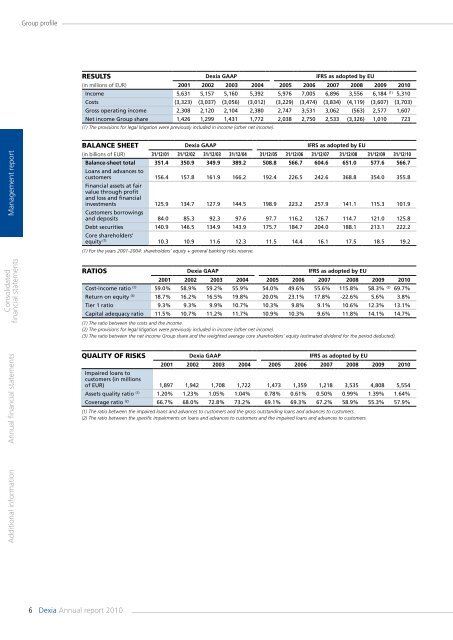
Group profileRESULTS <strong>Dexia</strong> GAAP IFRS as adopted by EU(in millions of EUR) 2001 2002 2003 2004 2005 2006 2007 2008 2009 <strong>2010</strong>In<strong>com</strong>e 5,631 5,157 5,160 5,392 5,976 7,005 6,896 3,556 6,184 (1) 5,310Costs (3,323) (3,037) (3,056) (3,012) (3,229) (3,474) (3,834) (4,119) (3,607) (3,703)Gross operating in<strong>com</strong>e 2,308 2,120 2,104 2,380 2,747 3,531 3,062 (563) 2,577 1,607Net in<strong>com</strong>e Group share 1,426 1,299 1,431 1,772 2,038 2,750 2,533 (3,326) 1,010 723(1) The provisions for legal litigation were previously included in in<strong>com</strong>e (other net in<strong>com</strong>e).Management <strong>report</strong>Consolidatedfinancial statementsBALANCE SHEET <strong>Dexia</strong> GAAP IFRS as adopted by EU(in billions of EUR) 31/12/01 31/12/02 31/12/03 31/12/04 31/12/05 31/12/06 31/12/07 31/12/08 31/12/09 31/12/10Balance-sheet total 351.4 350.9 349.9 389.2 508.8 566.7 604.6 651.0 577.6 566.7Loans and advances tocustomers 156.4 157.8 161.9 166.2 192.4 226.5 242.6 368.8 354.0 355.8Financial assets at fairvalue through profitand loss and financialinvestments 125.9 134.7 127.9 144.5 198.9 223.2 257.9 141.1 115.3 101.9Customers borrowingsand deposits 84.0 85.3 92.3 97.6 97.7 116.2 126.7 114.7 121.0 125.8Debt securities 140.9 146.5 134.9 143.9 175.7 184.7 204.0 188.1 213.1 222.2Core shareholders’equity (1) 10.3 10.9 11.6 12.3 11.5 14.4 16.1 17.5 18.5 19.2(1) For the years 2001-2004: shareholders’ equity + general banking risks reserve.Ratios <strong>Dexia</strong> GAAP IFRS as adopted by EU2001 2002 2003 2004 2005 2006 2007 2008 2009 <strong>2010</strong>Cost-in<strong>com</strong>e ratio (1) 59.0% 58.9% 59.2% 55.9% 54.0% 49.6% 55.6% 115.8% 58.3% (2) 69.7%Return on equity (3) 18.7% 16.2% 16.5% 19.8% 20.0% 23.1% 17.8% -22.6% 5.6% 3.8%Tier 1 ratio 9.3% 9.3% 9.9% 10.7% 10.3% 9.8% 9.1% 10.6% 12.3% 13.1%Capital adequacy ratio 11.5% 10.7% 11.2% 11.7% 10.9% 10.3% 9.6% 11.8% 14.1% 14.7%(1) The ratio between the costs and the in<strong>com</strong>e.(2) The provisions for legal litigation were previously included in in<strong>com</strong>e (other net in<strong>com</strong>e).(3) The ratio between the net in<strong>com</strong>e Group share and the weighted average core shareholders’ equity (estimated dividend for the period deducted).Additional information <strong>Annual</strong> financial statementsQUALITY OF RISKS <strong>Dexia</strong> GAAP IFRS as adopted by EU2001 2002 2003 2004 2005 2006 2007 2008 2009 <strong>2010</strong>Impaired loans tocustomers (in millionsof EUR) 1,897 1,942 1,708 1,722 1,473 1,359 1,218 3,535 4,808 5,554Assets quality ratio (1) 1.20% 1.23% 1.05% 1.04% 0.78% 0.61% 0.50% 0.99% 1.39% 1.64%Coverage ratio (2) 66.7% 68.0% 72.8% 73.2% 69.1% 69.3% 67.2% 58.9% 55.3% 57.9%(1) The ratio between the impaired loans and advances to customers and the gross outstanding loans and advances to customers.(2) The ratio between the specific impairments on loans and advances to customers and the impaired loans and advances to customers.6 <strong>Dexia</strong> <strong>Annual</strong> <strong>report</strong> <strong>2010</strong>