Annual report 2010 - Dexia.com
Annual report 2010 - Dexia.com
Annual report 2010 - Dexia.com
- No tags were found...

Create successful ePaper yourself
Turn your PDF publications into a flip-book with our unique Google optimized e-Paper software.
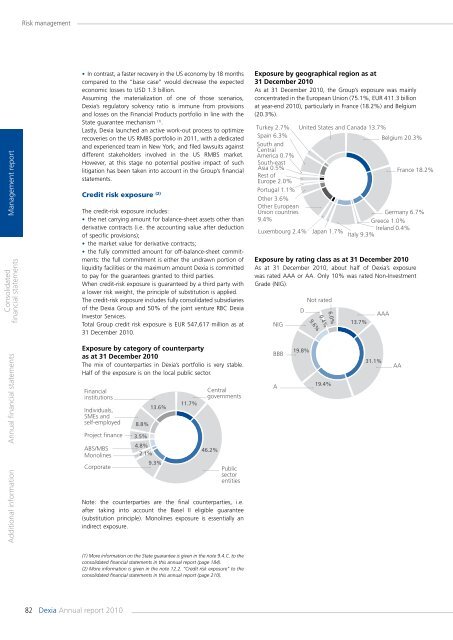
Risk managementManagement <strong>report</strong>Consolidatedfinancial statementsAdditional information <strong>Annual</strong> financial statementsFinancialinstitutions• In contrast, a faster recovery in the US economy by 18 months<strong>com</strong>pared to the “base case” would decrease the expectedeconomic losses to USD 1.3 billion.Assuming the materialization of one of those scenarios,<strong>Dexia</strong>’s regulatory solvency ratio is immune from provisionsand losses on the Financial Products portfolio in line with theState guarantee mechanism (1) .Lastly, <strong>Dexia</strong> launched an active Central work-out process to optimizerecoveries on the US RMBS portfolio governments in 2011, with a dedicatedand experienced team 11.7%13.6% in New York, and filed lawsuits againstIndividuals,different stakeholders involved in the US RMBS market.SMEs andself-employed However,8.8%at this stage no potential positive impact of suchlitigation has been taken into account in the Group’s financialFinancialCentralProject financeinstitutions statements. 3.5%governments4.8% 11.7%ABS/MBS13.6%Individuals, Credit risk exposure (2) 46.2%2.1%SMEs Monolines andself-employed9.3%Corporate 8.8%The credit-risk exposure includes: PublicProject financesector• 3.5% the net carrying amount for balance-sheetentitiesassets other thanderivative 4.8% contracts (i.e. the accounting value after deductionABS/MBS46.2%Monolinesof specific 2.1% provisions);• the market 9.3% value for derivative contracts;Corporate • the fully <strong>com</strong>mitted amount for Public off-balance-sheet <strong>com</strong>mitments:the full <strong>com</strong>mitment is either sector the undrawn portion ofentitiesliquidity facilities or the maximum amount <strong>Dexia</strong> is <strong>com</strong>mittedto pay for the guarantees granted to third parties.When credit-risk exposure is guaranteed by a third party witha lower risk weight, the principle of substitution is applied.The credit-risk exposure includes fully consolidated subsidiariesof the <strong>Dexia</strong> Group and 50% of the joint venture RBC <strong>Dexia</strong>Investor Services.Total Group credit risk exposure is EUR 547,617 million as at31 December <strong>2010</strong>.Exposure by category of counterpartyas at 31 December <strong>2010</strong>The mix of counterparties in <strong>Dexia</strong>’s portfolio is very stable.Half of the exposure is on the local public sector.FinancialinstitutionsIndividuals,SMEs andself-employedProject financeABS/MBSMonolinesCorporate8.8%3.5%4.8%2.1%13.6%9.3%11.7%Centralgovernments46.2%PublicsectorentitiesNote: the counterparties are the final counterparties, i.e.after taking into account the Basel II eligible guarantee(substitution principle). Monolines exposure is essentially anindirect exposure.Exposure by geographical region as at31 December <strong>2010</strong>As at 31 December <strong>2010</strong>, the Group’s exposure was mainlyconcentrated in the European Union (75.1%, EUR 411.3 billionat year-end <strong>2010</strong>), particularly in France (18.2%) and Belgium(20.3%).Turkey 2.7% United States and Canada 13.7%Spain 6.3% Belgium 20.3%South andCentralAmerica 0.7%South-eastTurkey Asia 2.7% 0.5% United States and Canada 13.7% France 18.2%Spain Rest 6.3% ofEurope 2.0%Belgium 20.3%South andCentral Portugal 1.1%America Other 0.7% 3.6%South-eastAsiaOther EuropeanUnion0.5%countriesGermany France 18.2% 6.7%Rest9.4%ofEurope 2.0%Greece 1.0%Ireland 0.4%Portugal Luxembourg 1.1% 2.4% Japan 1.7%Italy 9.3%Other 3.6%Other EuropeanUnion countriesGermany 6.7%9.4% Exposure by rating Not class rated as at 31 December Greece 1.0% <strong>2010</strong>As at 31 DLuxembourg AAAAT IONDecember <strong>2010</strong>, about half of Ireland <strong>Dexia</strong>’s 0.4% exposure2.4% Japan 1.7%was rated AAA or AA. Only 10% Italy was 9.3% rated Non-InvestmentNIG13.7%Grade (NIG).AT IONNIGBBBABBBAD19.8%19.8%9.6%9.6%0.4%0.4%Not rated6.0%6.0%19.4%13.7%AAA31.1%31.1%AAAATurkey 19.4% 2.7% United States and Canada 13.7%Spain 6.3% Belgium 20.South andCentralAmerica 0.7%South-eastAsia 0.5%FranceRest ofEurope 2.0%Portugal 1.1%Other 3.6%Other EuropeanUnion countries9.4%Luxembourg 2.4%AT IONNIGGermany 6Greece 1.0%Ireland 0.4%Japan 1.7%Italy 9.3%DNot rated9.6%0.4%6.0%13.7%AAA(1) More information on the State guarantee is given in the note 9.4.C. to theconsolidated financial statements in this annual <strong>report</strong> (page 184).(2) More information is given in the note 12.2. “Credit risk exposure” to theconsolidated financial statements in this annual <strong>report</strong> (page 210).BBB19.8%31.1%AA82 <strong>Dexia</strong> <strong>Annual</strong> <strong>report</strong> <strong>2010</strong>A19.4%