- Page 1:
A n n u a lr e p o r t2 0 1 0
- Page 4 and 5:
4 Group profile8 Message from the c
- Page 6 and 7:
Group profileManagement reportConso
- Page 8 and 9:
Group profileRESULTS Dexia GAAP IFR
- Page 10 and 11:
Message from the ChairmenManagement
- Page 12 and 13:
2010 and early 2011 highlightsManag
- Page 14 and 15:
2010 and early 2011 highlightsDecem
- Page 16 and 17:
Update on the transformation planMa
- Page 18 and 19:
Update on the transformation planMa
- Page 20 and 21:
StrategyManagement reportConsolidat
- Page 22 and 23:
Declaration of corporategovernanceM
- Page 24 and 25:
Declaration of corporate governance
- Page 26 and 27:
Declaration of corporate governance
- Page 28 and 29:
Declaration of corporate governance
- Page 30 and 31:
Declaration of corporate governance
- Page 32 and 33:
Declaration of corporate governance
- Page 34 and 35:
Declaration of corporate governance
- Page 36 and 37:
Declaration of corporate governance
- Page 38 and 39:
Declaration of corporate governance
- Page 40 and 41:
Declaration of corporate governance
- Page 42 and 43:
Declaration of corporate governance
- Page 44 and 45:
Declaration of corporate governance
- Page 46 and 47:
Declaration of corporate governance
- Page 48 and 49:
Declaration of corporate governance
- Page 50 and 51:
Declaration of corporate governance
- Page 52 and 53:
Declaration of corporate governance
- Page 54 and 55:
Declaration of corporate governance
- Page 56 and 57:
Declaration of corporate governance
- Page 58 and 59:
Declaration of corporate governance
- Page 60 and 61:
Declaration of corporate governance
- Page 62 and 63:
Declaration of corporate governance
- Page 64 and 65:
Declaration of corporate governance
- Page 66 and 67:
Declaration of corporate governance
- Page 68 and 69:
Declaration of corporate governance
- Page 70 and 71:
Shareholder informationManagement r
- Page 72 and 73:
Shareholder informationManagement r
- Page 74 and 75:
Human ResourcesMEMBERS OF STAFFGEND
- Page 76 and 77:
Human ResourcesFinally, questions r
- Page 78 and 79:
Sustainable developmentEnergy perfo
- Page 80 and 81:
Risk managementManagement reportCon
- Page 82 and 83:
Risk managementThe Operational Risk
- Page 84 and 85:
Risk managementManagement reportCon
- Page 86 and 87:
Risk managementManagement reportCon
- Page 88 and 89:
Risk managementManagement reportCon
- Page 90 and 91:
Risk managementManagement reportCon
- Page 92 and 93:
Risk managementManagement reportCon
- Page 94 and 95:
Risk managementManagement reportCon
- Page 96 and 97:
Risk managementManagement reportCon
- Page 98 and 99:
Capital managementManagement report
- Page 100 and 101:
Capital managementEconomic capitalE
- Page 102 and 103:
Financial resultsConsolidated state
- Page 104 and 105:
Financial resultsManagement reportC
- Page 106 and 107:
Activity and results of the busines
- Page 108 and 109:
Activity and results of the busines
- Page 110 and 111:
Activity and results of the busines
- Page 112 and 113:
Activity and results of the busines
- Page 114 and 115:
Activity and results of the busines
- Page 116:
Activity and results of the busines
- Page 119 and 120:
C o n s o l i d a t e d f i n a n c
- Page 121 and 122: Liabilities Note 31/12/09 31/12/10(
- Page 123 and 124: Consolidated statementof changes in
- Page 125 and 126: Gains and losses not recognised in
- Page 127 and 128: Consolidated cash flow statement(in
- Page 129 and 130: Notes to the consolidated financial
- Page 131 and 132: Notes to the consolidated financial
- Page 133: Notes to the consolidated financial
- Page 136 and 137: Notes to the consolidated financial
- Page 138 and 139: Notes to the consolidated financial
- Page 140 and 141: Notes to the consolidated financial
- Page 142: Notes to the consolidated financial
- Page 145: Notes to the consolidated financial
- Page 148 and 149: Notes to the consolidated financial
- Page 151 and 152: Notes to the consolidated financial
- Page 153 and 154: Notes to the consolidated financial
- Page 155 and 156: Notes to the consolidated financial
- Page 157 and 158: Notes to the consolidated financial
- Page 159 and 160: Notes to the consolidated financial
- Page 161 and 162: Notes to the consolidated financial
- Page 163 and 164: Notes to the consolidated financial
- Page 165 and 166: Notes to the consolidated financial
- Page 167 and 168: Notes to the consolidated financial
- Page 169 and 170: Notes to the consolidated financial
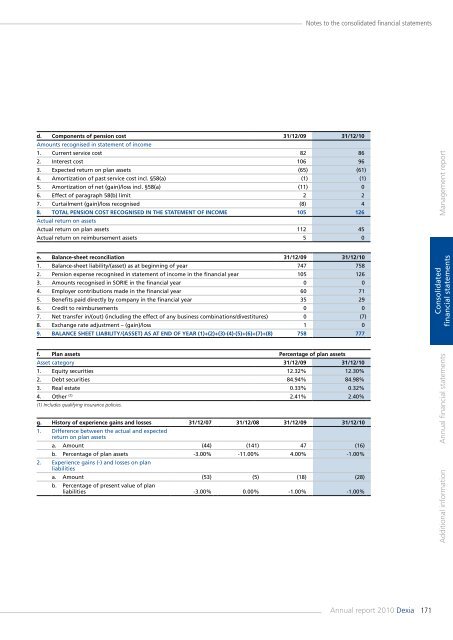
- Page 171: Notes to the consolidated financial
- Page 175 and 176: Notes to the consolidated financial
- Page 177 and 178: Notes to the consolidated financial
- Page 179 and 180: Notes to the consolidated financial
- Page 181 and 182: Notes to the consolidated financial
- Page 183 and 184: Notes to the consolidated financial
- Page 185 and 186: Notes to the consolidated financial
- Page 187 and 188: Notes to the consolidated financial
- Page 189 and 190: Notes to the consolidated financial
- Page 191 and 192: Notes to the consolidated financial
- Page 193 and 194: Notes to the consolidated financial
- Page 195 and 196: Notes to the consolidated financial
- Page 197 and 198: Notes to the consolidated financial
- Page 199 and 200: Notes to the consolidated financial
- Page 201 and 202: Notes to the consolidated financial
- Page 203 and 204: Notes to the consolidated financial
- Page 205 and 206: Notes to the consolidated financial
- Page 207 and 208: Notes to the consolidated financial
- Page 209 and 210: Notes to the consolidated financial
- Page 211 and 212: Notes to the consolidated financial
- Page 213 and 214: Notes to the consolidated financial
- Page 215 and 216: Notes to the consolidated financial
- Page 217 and 218: Notes to the consolidated financial
- Page 219 and 220: Notes to the consolidated financial
- Page 221 and 222: Notes to the consolidated financial
- Page 223 and 224:
Notes to the consolidated financial
- Page 225 and 226:
Notes to the consolidated financial
- Page 227 and 228:
Notes to the consolidated financial
- Page 229 and 230:
Notes to the consolidated financial
- Page 231 and 232:
Notes to the consolidated financial
- Page 233 and 234:
Notes to the consolidated financial
- Page 235 and 236:
Notes to the consolidated financial
- Page 237 and 238:
Dexia saStatutory Auditor's reporto
- Page 240 and 241:
240 Balance sheet241 Off-balance-sh
- Page 242 and 243:
Balance sheet(before income appropr
- Page 244 and 245:
Statement of incomeManagement repor
- Page 246 and 247:
Notes to the annual financial state
- Page 248 and 249:
Notes to the annual financial state
- Page 250 and 251:
Notes to the annual financial state
- Page 252 and 253:
Notes to the annual financial state
- Page 254 and 255:
Notes to the annual financial state
- Page 256 and 257:
Notes to the annual financial state
- Page 258 and 259:
Notes to the annual financial state
- Page 260 and 261:
Notes to the annual financial state
- Page 262 and 263:
Statutory Auditor's reportManagemen
- Page 264 and 265:
Additional informationManagement re
- Page 267 and 268:
Photographs: page 8: C. LEBEDINSKY/