Annual report 2010 - Dexia.com
Annual report 2010 - Dexia.com
Annual report 2010 - Dexia.com
- No tags were found...

Create successful ePaper yourself
Turn your PDF publications into a flip-book with our unique Google optimized e-Paper software.
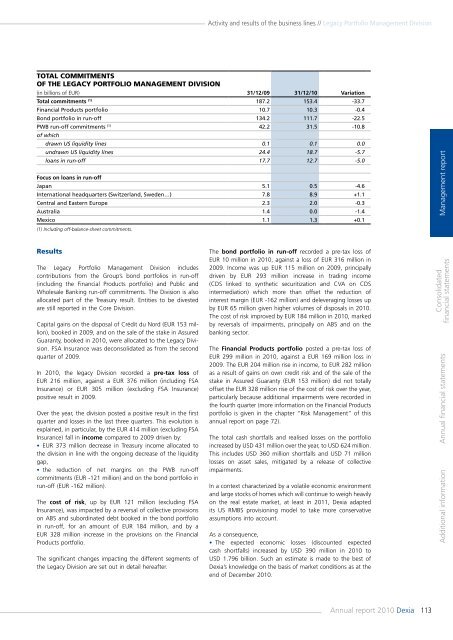
Activity and results of the business lines // Legacy Portfolio Management DivisionTotal <strong>com</strong>mitmentsof the Legacy Portfolio Management Division(in billions of EUR) 31/12/09 31/12/10 VariationTotal <strong>com</strong>mitments (1) 187.2 153.4 -33.7Financial Products portfolio 10.7 10.3 -0.4Bond portfolio in run-off 134.2 111.7 -22.5PWB run-off <strong>com</strong>mitments (1) 42.2 31.5 -10.8of whichdrawn US liquidity lines 0.1 0.1 0.0undrawn US liquidity lines 24.4 18.7 -5.7loans in run-off 17.7 12.7 -5.0Focus on loans in run-offJapan 5.1 0.5 -4.6International headquarters (Switzerland, Sweden…) 7.8 8.9 +1.1Central and Eastern Europe 2.3 2.0 -0.3Australia 1.4 0.0 -1.4Mexico 1.1 1.3 +0.1(1) Including off-balance-sheet <strong>com</strong>mitments.Management <strong>report</strong>ResultsThe Legacy Portfolio Management Division includescontributions from the Group’s bond portfolios in run-off(including the Financial Products portfolio) and Public andWholesale Banking run-off <strong>com</strong>mitments. The Division is alsoallocated part of the Treasury result. Entities to be divestedare still <strong>report</strong>ed in the Core Division.Capital gains on the disposal of Crédit du Nord (EUR 153 million),booked in 2009, and on the sale of the stake in AssuredGuaranty, booked in <strong>2010</strong>, were allocated to the Legacy Division.FSA Insurance was deconsolidated as from the secondquarter of 2009.In <strong>2010</strong>, the legacy Division recorded a pre-tax loss ofEUR 216 million, against a EUR 376 million (including FSAInsurance) or EUR 305 million (excluding FSA Insurance)positive result in 2009.Over the year, the division posted a positive result in the firstquarter and losses in the last three quarters. This evolution isexplained, in particular, by the EUR 414 million (excluding FSAInsurance) fall in in<strong>com</strong>e <strong>com</strong>pared to 2009 driven by:• EUR 373 million decrease in Treasury in<strong>com</strong>e allocated tothe division in line with the ongoing decrease of the liquiditygap,• the reduction of net margins on the PWB run-off<strong>com</strong>mitments (EUR -121 million) and on the bond portfolio inrun-off (EUR -162 million).The cost of risk, up by EUR 121 million (excluding FSAInsurance), was impacted by a reversal of collective provisionson ABS and subordinated debt booked in the bond portfolioin run-off, for an amount of EUR 184 million, and by aEUR 328 million increase in the provisions on the FinancialProducts portfolio.The significant changes impacting the different segments ofthe Legacy Division are set out in detail hereafter.The bond portfolio in run-off recorded a pre-tax loss ofEUR 10 million in <strong>2010</strong>, against a loss of EUR 316 million in2009. In<strong>com</strong>e was up EUR 115 million on 2009, principallydriven by EUR 293 million increase in trading in<strong>com</strong>e(CDS linked to synthetic securitization and CVA on CDSintermediation) which more than offset the reduction ofinterest margin (EUR -162 million) and deleveraging losses upby EUR 65 million given higher volumes of disposals in <strong>2010</strong>.The cost of risk improved by EUR 184 million in <strong>2010</strong>, markedby reversals of impairments, principally on ABS and on thebanking sector.The Financial Products portfolio posted a pre-tax loss ofEUR 299 million in <strong>2010</strong>, against a EUR 169 million loss in2009. The EUR 204 million rise in in<strong>com</strong>e, to EUR 282 millionas a result of gains on own credit risk and of the sale of thestake in Assured Guaranty (EUR 153 million) did not totallyoffset the EUR 328 million rise of the cost of risk over the year,particularly because additional impairments were recorded inthe fourth quarter (more information on the Financial Productsportfolio is given in the chapter “Risk Management” of thisannual <strong>report</strong> on page 72).The total cash shortfalls and realised losses on the portfolioincreased by USD 431 million over the year, to USD 624 million.This includes USD 360 million shortfalls and USD 71 millionlosses on asset sales, mitigated by a release of collectiveimpairments.In a context characterized by a volatile economic environmentand large stocks of homes which will continue to weigh heavilyon the real estate market, at least in 2011, <strong>Dexia</strong> adaptedits US RMBS provisioning model to take more conservativeassumptions into account.As a consequence,• The expected economic losses (discounted expectedcash shortfalls) increased by USD 390 million in <strong>2010</strong> toUSD 1.796 billion. Such an estimate is made to the best of<strong>Dexia</strong>’s knowledge on the basis of market conditions as at theend of December <strong>2010</strong>.Consolidatedfinancial statementsAdditional information <strong>Annual</strong> financial statements<strong>Annual</strong> <strong>report</strong> <strong>2010</strong> <strong>Dexia</strong>113