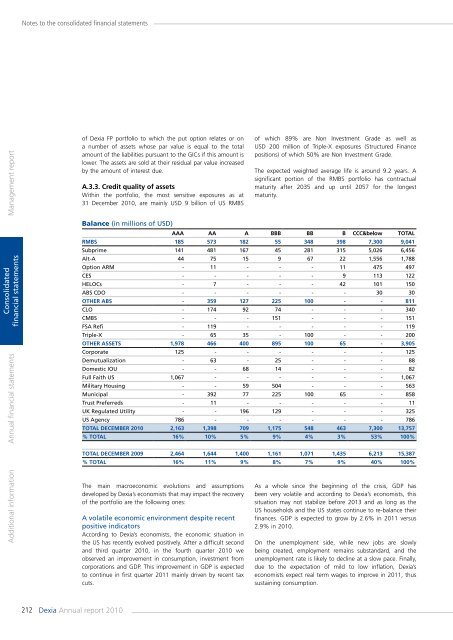
Notes to the consolidated financial statementsManagement <strong>report</strong>of <strong>Dexia</strong> FP portfolio to which the put option relates or ona number of assets whose par value is equal to the totalamount of the liabilities pursuant to the GICs if this amount islower. The assets are sold at their residual par value increasedby the amount of interest due.A.3.3. Credit quality of assetsWithin the portfolio, the most sensitive exposures as at31 December <strong>2010</strong>, are mainly USD 9 billion of US RMBSof which 89% are Non Investment Grade as well asUSD 200 million of Triple-X exposures (Structured Financepositions) of which 50% are Non Investment Grade.The expected weighted average life is around 9.2 years. Asignificant portion of the RMBS portfolio has contractualmaturity after 2035 and up until 2057 for the longestmaturity.Consolidatedfinancial statementsAdditional information <strong>Annual</strong> financial statementsBalance (in millions of USD)AAA AA A BBB BB B CCC&below TOTALRMBS 185 573 182 55 348 398 7,300 9,041Subprime 141 481 167 45 281 315 5,026 6,456Alt-A 44 75 15 9 67 22 1,556 1,788Option ARM - 11 - - - 11 475 497CES - - - - - 9 113 122HELOCs - 7 - - - 42 101 150ABS CDO - - - - - - 30 30Other ABS - 359 127 225 100 - - 811CLO - 174 92 74 - - - 340CMBS - - - 151 - - - 151FSA Refi - 119 - - - - - 119Triple-X - 65 35 - 100 - - 200Other assets 1,978 466 400 895 100 65 - 3,905Corporate 125 - - - - - - 125Demutualization - 63 - 25 - - - 88Domestic IOU - - 68 14 - - - 82Full Faith US 1,067 - - - - - - 1,067Military Housing - - 59 504 - - - 563Municipal - 392 77 225 100 65 - 858Trust Preferreds - 11 - - - - - 11UK Regulated Utility - - 196 129 - - - 325US Agency 786 - - - - - - 786TOTAL December <strong>2010</strong> 2,163 1,398 709 1,175 548 463 7,300 13,757% Total 16% 10% 5% 9% 4% 3% 53% 100%TOTAL December 2009 2,464 1,644 1,400 1,161 1,071 1,435 6,213 15,387% Total 16% 11% 9% 8% 7% 9% 40% 100%The main macroeconomic evolutions and assumptionsdeveloped by <strong>Dexia</strong>’s economists that may impact the recoveryof the portfolio are the following ones:A volatile economic environment despite recentpositive indicatorsAccording to <strong>Dexia</strong>’s economists, the economic situation inthe US has recently evolved positively. After a difficult secondand third quarter <strong>2010</strong>, in the fourth quarter <strong>2010</strong> weobserved an improvement in consumption, investment fromcorporations and GDP. This improvement in GDP is expectedto continue in first quarter 2011 mainly driven by recent taxcuts.As a whole since the beginning of the crisis, GDP hasbeen very volatile and according to <strong>Dexia</strong>’s economists, thissituation may not stabilize before 2013 and as long as theUS households and the US states continue to re-balance theirfinances. GDP is expected to grow by 2.6% in 2011 versus2.9% in <strong>2010</strong>.On the unemployment side, while new jobs are slowlybeing created, employment remains substandard, and theunemployment rate is likely to decline at a slow pace. Finally,due to the expectation of mild to low inflation, <strong>Dexia</strong>’seconomists expect real term wages to improve in 2011, thussustaining consumption.212 <strong>Dexia</strong> <strong>Annual</strong> <strong>report</strong> <strong>2010</strong>
Notes to the consolidated financial statementsThe stock of homes will continue to weigh heavilyon the US real estate market at least in 2011According to Realty Trac (1) , foreclosures reached 1 millionunits in <strong>2010</strong> and should continue at this level into andbeyond 2011. The US real estate market is still in the midstof a deep crisis and there remains a large stock of homesfor sale. Based on the current level of housing stocks andthe assessed shadow inventory (properties from borrowers indefault on their loan and which are very likely to appear onthe market for sale in the next few months) that may <strong>com</strong>eto the market within the next 2 to 3 years, it could take 4 to6 years before the real estate market normalizes. Therefore,<strong>Dexia</strong>’s economists expect a slight further decline in prices in2011.A.3.4. Accounting value and treatmentThe <strong>Dexia</strong> FP portfolio has a net accounting value of USD 9.9billion as at 31 December <strong>2010</strong>. This amount is the net of atotal portfolio at par of USD 14.3 billion, less collective andspecific impairments amounting USD 2.2 billion and negativeAFS reserves amounting USD 2.2 billion as well. Within thetotal portfolio of USD 14.3 billion, USD 0.4 billion are notguaranteed bonds (2) and interests accruals amounts USD 0.1billion, giving the portfolio analyzed in point A.3.3. “Creditquality of assets”, of USD 13.8 billion.On 1 October 2008, in accordance with IAS 39, <strong>Dexia</strong>reclassified in Loans and Receivables (from the Available-for-Sale category) the illiquid part of the <strong>Dexia</strong> FP portfolio, whichincludes all instruments exposed to the US RMBS market.As a consequence of the reclassification, the <strong>Dexia</strong> FP portfoliois now <strong>com</strong>posed of two parts:1/ Available-for-Sale assets, which are high quality liquidinvestments at fair value through other <strong>com</strong>prehensivein<strong>com</strong>e. The net accounting value of USD 2,742 millionincludes USD 408 million of highly liquid bonds not coveredby the States’ guarantee.The net AFS portfolio includes a negative AFS reserve (beforetax) of USD 0.2 billion. The AFS portfolio value varies withthe evolution of the fair value of the underlying bonds. Nocollective impairment can be recorded on assets classifiedin AFS portfolio. In case of specific impairment, the AFSreserve is recorded in result of the period, and the differencebetween the recoverable amount and the net accountingvalue is recorded in the net interest in<strong>com</strong>e, based on theremaining life of the related asset (amortization using theeffective interest rate). No impairment is recorded on this AFSportfolio.2/ Reclassified Loans and Receivables which are illiquidinvestments and subject to both specific and collectiveimpairments: net accounting value of USD 7,196 million asat 31 December <strong>2010</strong>.The Loans & Receivables portfolio includes bonds that havebeen reclassified at fair value on 1 October 2008, due to theilliquidity of some markets. The negative AFS reserve fromthat date was “frozen” and is amortized on the remaininglife of the related bonds via the effective interest rate, withrecording in P&L this net negative AFS reserve in case ofsale or of impairment. The negative AFS reserve (before tax)amounts USD 2 billion as at 31 December <strong>2010</strong>.A collective impairment has been set up at the moment ofreclassification and is updated on a quarterly basis based onthe evolution of the not individually impaired portfolio. Thecollective impairment is based on different assumptions thatmay influence the level of impairments (see points A.3.3. andA.3.5.) and amounts USD 438 million as at 31 December<strong>2010</strong>.Specific impairments amount to USD 1,742 million as at 31December <strong>2010</strong>. Specific impairments are decided by theImpairment Committee based on its evaluation of incurredlosses. This evaluation takes into account the expectedshortfall of payment of principal and/or interests, theirprobable realization in the near future and its own overallestimation of the situation of the underlying portfolio. Oncea security is deemed impaired on a specific basis, all its futurecash-flows are taken into account for the calculation of theimpairment. According to IAS 39, for reclassified bonds in L&R,the interest rate used to calculate the Net Present Value ofCash Flows is not the original interest rate (at purchase date)but the effective interest rate at reclassification date, meaningthat this interest rate may be high if the market value of thebond at reclassification date was low. This implies that thenet unamortized “frozen” AFS reserve is recycled into result,in addition with expected missing cash flows. The differencebetween the recoverable amount and the net accountingamount after impairment is subsequently recorded in the netinterest in<strong>com</strong>e, like for AFS bonds.The total impairments amount therefore to USD 2,252million on Reclassified Loans and Receivables which is<strong>com</strong>posed of collective impairments of USD 438 million,specific impairment of USD 1,742 million and effect of theloss of USD 72 million recorded on the exchange of assets(<strong>com</strong>mutation) .(1) Founded in 1996, RealtyTrac® (www.realtytrac.<strong>com</strong>), is the leading online marketplace of foreclosure properties, with more than 1.5 million default, auctionand bank-owned listings from over 2,200 U.S. counties, along with detailed property, loan and home sales data. The <strong>com</strong>pany’s mission is to make it easier forconsumers, investors and real estate professionals to locate, evaluate, buy and sell properties. RealtyTrac collects and aggregates foreclosure data from morethan 2,200 counties, covering more than 90 percent of U.S. households, appends the data with estimated property values, <strong>com</strong>parable sales, loan history, taxlien and bankruptcy records, trustee and lender information and property details and updates the entire database twice daily.(2) Bonds purchased after the granting of the guarantee.Management <strong>report</strong>Consolidatedfinancial statementsAdditional information <strong>Annual</strong> financial statements<strong>Annual</strong> <strong>report</strong> <strong>2010</strong> <strong>Dexia</strong>213