Annual report 2010 - Dexia.com
Annual report 2010 - Dexia.com
Annual report 2010 - Dexia.com
- No tags were found...

You also want an ePaper? Increase the reach of your titles
YUMPU automatically turns print PDFs into web optimized ePapers that Google loves.
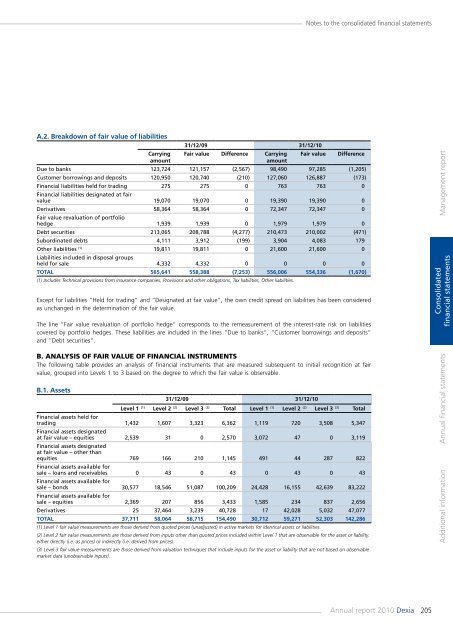
Notes to the consolidated financial statementsA.2. Breakdown of fair value of liabilitiesCarryingamount31/12/09 31/12/10Fair value Difference CarryingamountFair valueDifferenceDue to banks 123,724 121,157 (2,567) 98,490 97,285 (1,205)Customer borrowings and deposits 120,950 120,740 (210) 127,060 126,887 (173)Financial liabilities held for trading 275 275 0 763 763 0Financial liabilities designated at fairvalue 19,070 19,070 0 19,390 19,390 0Derivatives 58,364 58,364 0 72,347 72,347 0Fair value revaluation of portfoliohedge 1,939 1,939 0 1,979 1,979 0Debt securities 213,065 208,788 (4,277) 210,473 210,002 (471)Subordinated debts 4,111 3,912 (199) 3,904 4,083 179Other liabilities (1) 19,811 19,811 0 21,600 21,600 0Liabilities included in disposal groupsheld for sale 4,332 4,332 0 0 0 0Total 565,641 558,388 (7,253) 556,006 554,336 (1,670)(1) Includes Technical provisions from insurance <strong>com</strong>panies, Provisions and other obligations, Tax liabilities, Other liabilities.Except for liabilities “Held for trading“ and “Designated at fair value“, the own credit spread on liabilities has been consideredas unchanged in the determination of the fair value.The line “Fair value revaluation of portfolio hedge“ corresponds to the remeasurement of the interest-rate risk on liabilitiescovered by portfolio hedges. These liabilities are included in the lines “Due to banks“, “Customer borrowings and deposits“and “Debt securities“.B. Analysis of fair value of financial instrumentsThe following table provides an analysis of financial instruments that are measured subsequent to initial recognition at fairvalue, grouped into Levels 1 to 3 based on the degree to which the fair value is observable.B.1. Assets31/12/09 31/12/10Level 1 (1) Level 2 (2) Level 3 (3) Total Level 1 (1) Level 2 (2) Level 3 (3) TotalFinancial assets held fortrading 1,432 1,607 3,323 6,362 1,119 720 3,508 5,347Financial assets designatedat fair value – equities 2,539 31 0 2,570 3,072 47 0 3,119Financial assets designatedat fair value – other thanequities 769 166 210 1,145 491 44 287 822Financial assets available forsale – loans and receivables 0 43 0 43 0 43 0 43Financial assets available forsale – bonds 30,577 18,546 51,087 100,209 24,428 16,155 42,639 83,222Financial assets available forsale – equities 2,369 207 856 3,433 1,585 234 837 2,656Derivatives 25 37,464 3,239 40,728 17 42,028 5,032 47,077Total 37,711 58,064 58,715 154,490 30,712 59,271 52,303 142,286(1) Level 1 fair value measurements are those derived from quoted prices (unadjusted) in active markets for identical assets or liabilities.(2) Level 2 fair value measurements are those derived from inputs other than quoted prices included within Level 1 that are observable for the asset or liability,either directly (i.e. as prices) or indirectly (i.e. derived from prices).(3) Level 3 fair value measurements are those derived from valuation techniques that include inputs for the asset or liability that are not based on observablemarket data (unobservable inputs).Management <strong>report</strong>Consolidatedfinancial statementsAdditional information <strong>Annual</strong> financial statements<strong>Annual</strong> <strong>report</strong> <strong>2010</strong> <strong>Dexia</strong>205