Works Approval Report.pdf - the National Capital Authority
Works Approval Report.pdf - the National Capital Authority
Works Approval Report.pdf - the National Capital Authority

You also want an ePaper? Increase the reach of your titles
YUMPU automatically turns print PDFs into web optimized ePapers that Google loves.
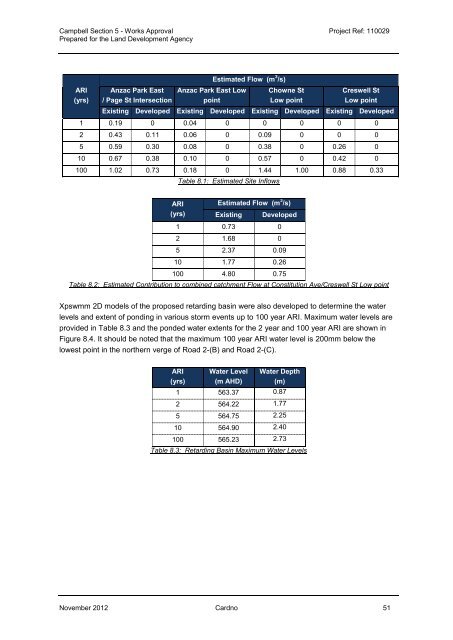
Campbell Section 5 - <strong>Works</strong> <strong>Approval</strong> Project Ref: 110029Prepared for <strong>the</strong> Land Development AgencyARI(yrs)Anzac Park East/ Page St IntersectionAnzac Park East LowpointEstimated Flow (m 3 /s)Chowne StLow pointCreswell StLow pointExisting Developed Existing Developed Existing Developed Existing Developed1 0.19 0 0.04 0 0 0 0 02 0.43 0.11 0.06 0 0.09 0 0 05 0.59 0.30 0.08 0 0.38 0 0.26 010 0.67 0.38 0.10 0 0.57 0 0.42 0100 1.02 0.73 0.18 0 1.44 1.00 0.88 0.33Table 8.1: Estimated Site InflowsARI(yrs)Estimated Flow (m 3 /s)ExistingDeveloped1 0.73 02 1.68 05 2.37 0.0910 1.77 0.26100 4.80 0.75Table 8.2: Estimated Contribution to combined catchment Flow at Constitution Ave/Creswell St Low pointXpswmm 2D models of <strong>the</strong> proposed retarding basin were also developed to determine <strong>the</strong> waterlevels and extent of ponding in various storm events up to 100 year ARI. Maximum water levels areprovided in Table 8.3 and <strong>the</strong> ponded water extents for <strong>the</strong> 2 year and 100 year ARI are shown inFigure 8.4. It should be noted that <strong>the</strong> maximum 100 year ARI water level is 200mm below <strong>the</strong>lowest point in <strong>the</strong> nor<strong>the</strong>rn verge of Road 2-(B) and Road 2-(C).ARI(yrs)Water Level(m AHD)Water Depth(m)1 563.37 0.872 564.22 1.775 564.75 2.2510 564.90 2.40100 565.23 2.73Table 8.3: Retarding Basin Maximum Water LevelsNovember 2012 Cardno 51