Kingscote Airport Business Case Appendices - Kangaroo Island ...
Kingscote Airport Business Case Appendices - Kangaroo Island ...
Kingscote Airport Business Case Appendices - Kangaroo Island ...
- No tags were found...

You also want an ePaper? Increase the reach of your titles
YUMPU automatically turns print PDFs into web optimized ePapers that Google loves.
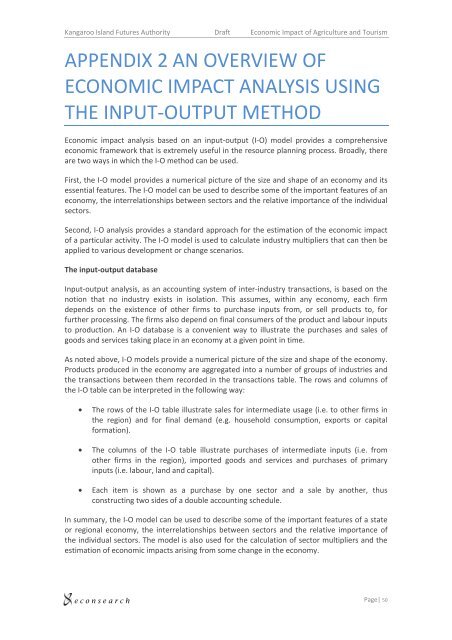
<strong>Kangaroo</strong> <strong>Island</strong> Futures Authority Draft Economic Impact of Agriculture and TourismAPPENDIX 2 AN OVERVIEW OFECONOMIC IMPACT ANALYSIS USINGTHE INPUT-OUTPUT METHODEconomic impact analysis based on an input-output (I-O) model provides a comprehensiveeconomic framework that is extremely useful in the resource planning process. Broadly, thereare two ways in which the I-O method can be used.First, the I-O model provides a numerical picture of the size and shape of an economy and itsessential features. The I-O model can be used to describe some of the important features of aneconomy, the interrelationships between sectors and the relative importance of the individualsectors.Second, I-O analysis provides a standard approach for the estimation of the economic impactof a particular activity. The I-O model is used to calculate industry multipliers that can then beapplied to various development or change scenarios.The input-output databaseInput-output analysis, as an accounting system of inter-industry transactions, is based on thenotion that no industry exists in isolation. This assumes, within any economy, each firmdepends on the existence of other firms to purchase inputs from, or sell products to, forfurther processing. The firms also depend on final consumers of the product and labour inputsto production. An I-O database is a convenient way to illustrate the purchases and sales ofgoods and services taking place in an economy at a given point in time.As noted above, I-O models provide a numerical picture of the size and shape of the economy.Products produced in the economy are aggregated into a number of groups of industries andthe transactions between them recorded in the transactions table. The rows and columns ofthe I-O table can be interpreted in the following way:• The rows of the I-O table illustrate sales for intermediate usage (i.e. to other firms inthe region) and for final demand (e.g. household consumption, exports or capitalformation).• The columns of the I-O table illustrate purchases of intermediate inputs (i.e. fromother firms in the region), imported goods and services and purchases of primaryinputs (i.e. labour, land and capital).• Each item is shown as a purchase by one sector and a sale by another, thusconstructing two sides of a double accounting schedule.In summary, the I-O model can be used to describe some of the important features of a stateor regional economy, the interrelationships between sectors and the relative importance ofthe individual sectors. The model is also used for the calculation of sector multipliers and theestimation of economic impacts arising from some change in the economy.e c o n s e a r c hPage| 50