Arab Knowledge Report 2009: Towards Productive
Arab Knowledge Report 2009: Towards Productive
Arab Knowledge Report 2009: Towards Productive
- No tags were found...
Create successful ePaper yourself
Turn your PDF publications into a flip-book with our unique Google optimized e-Paper software.
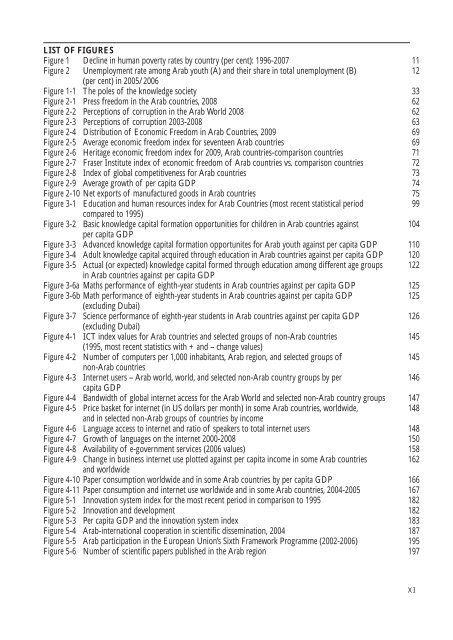
LIST OF FIGURESFigure 1 Decline in human poverty rates by country (per cent): 1996-2007Figure 2 Unemployment rate among <strong>Arab</strong> youth (A) and their share in total unemployment (B)(per cent) in 2005/2006Figure 1-1 The poles of the knowledge societyFigure 2-1 Press freedom in the <strong>Arab</strong> countries, 2008Figure 2-2 Perceptions of corruption in the <strong>Arab</strong> World 2008Figure 2-3 Perceptions of corruption 2003-2008Figure 2-4 Distribution of Economic Freedom in <strong>Arab</strong> Countries, <strong>2009</strong>Figure 2-5 Average economic freedom index for seventeen <strong>Arab</strong> countriesFigure 2-6 Heritage economic freedom index for <strong>2009</strong>, <strong>Arab</strong> countries-comparison countriesFigure 2-7 Fraser Institute index of economic freedom of <strong>Arab</strong> countries vs. comparison countriesFigure 2-8 Index of global competitiveness for <strong>Arab</strong> countriesFigure 2-9 Average growth of per capita GDPFigure 2-10 Net exports of manufactured goods in <strong>Arab</strong> countriesFigure 3-1 Education and human resources index for <strong>Arab</strong> Countries (most recent statistical periodcompared to 1995)Figure 3-2 Basic knowledge capital formation opportunities for children in <strong>Arab</strong> countries againstper capita GDPFigure 3-3 Advanced knowledge capital formation opportunites for <strong>Arab</strong> youth against per capita GDPFigure 3-4 Adult knowledge capital acquired through education in <strong>Arab</strong> countries against per capita GDPFigure 3-5 Actual (or expected) knowledge capital formed through education among different age groupsin <strong>Arab</strong> countries against per capita GDPFigure 3-6a Maths performance of eighth-year students in <strong>Arab</strong> countries against per capita GDPFigure 3-6b Math performance of eighth-year students in <strong>Arab</strong> countries against per capita GDP(excluding Dubai)Figure 3-7 Science performance of eighth-year students in <strong>Arab</strong> countries against per capita GDP(excluding Dubai)Figure 4-1 ICT index values for <strong>Arab</strong> countries and selected groups of non-<strong>Arab</strong> countries(1995, most recent statistics with + and – change values)Figure 4-2 Number of computers per 1,000 inhabitants, <strong>Arab</strong> region, and selected groups ofnon-<strong>Arab</strong> countriesFigure 4-3 Internet users – <strong>Arab</strong> world, world, and selected non-<strong>Arab</strong> country groups by percapita GDPFigure 4-4 Bandwidth of global internet access for the <strong>Arab</strong> World and selected non-<strong>Arab</strong> country groupsFigure 4-5 Price basket for internet (in US dollars per month) in some <strong>Arab</strong> countries, worldwide,and in selected non-<strong>Arab</strong> groups of countries by incomeFigure 4-6 Language access to internet and ratio of speakers to total internet usersFigure 4-7 Growth of languages on the internet 2000-2008Figure 4-8 Availability of e-government services (2006 values)Figure 4-9 Change in business internet use plotted against per capita income in some <strong>Arab</strong> countriesand worldwideFigure 4-10 Paper consumption worldwide and in some <strong>Arab</strong> countries by per capita GDPFigure 4-11 Paper consumption and internet use worldwide and in some <strong>Arab</strong> countries, 2004-2005Figure 5-1 Innovation system index for the most recent period in comparison to 1995Figure 5-2 Innovation and developmentFigure 5-3 Per capita GDP and the innovation system indexFigure 5-4 <strong>Arab</strong>-international cooperation in scientific dissemination, 2004Figure 5-5 <strong>Arab</strong> participation in the European Union’s Sixth Framework Programme (2002-2006)Figure 5-6 Number of scientific papers published in the <strong>Arab</strong> region1112336262636969717273747599104110120122125125126145145146147148148150158162166167182182183187195197XI


