- Page 1 and 2:
United Nations Development Programm
- Page 3 and 4:
This Report has been produced throu
- Page 5 and 6:
This year’s report may perhapsbes
- Page 7 and 8:
ICT in the Arab countries and reinf
- Page 9 and 10:
CONTENTSPREAMBLEIntroductionPrelimi
- Page 11 and 12:
Quantitative indicatorsTertiary edu
- Page 13 and 14:
LIST OF BOXESBox 1 The Effect of th
- Page 15 and 16:
Figure 5-7 Published scientific art
- Page 17 and 18:
Table 21 Time devoted to secondary
- Page 19 and 20:
The knowledgefield and revolutionto
- Page 21 and 22:
The literature onhuman rights place
- Page 23 and 24:
Arabic istechnologicallypoor in com
- Page 25 and 26:
Intercommunicationwith the self mea
- Page 27 and 28:
Table 2CountryGroupGroup 1: Oilecon
- Page 29 and 30:
Figure 2504540353025201510508070605
- Page 31 and 32:
In the period2003-2007, morethan 83
- Page 34 and 35:
eversion, in many cases, is not ass
- Page 36 and 37:
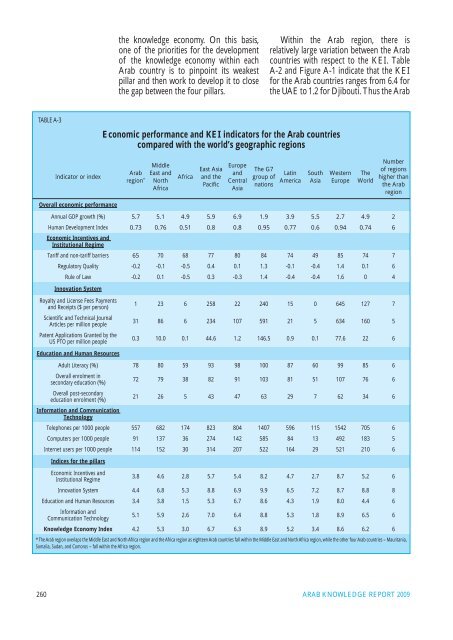
Thus the Arab region in general, an
- Page 38 and 39:
knowledge over recent years. This w
- Page 40 and 41:
However, this progress remains limi
- Page 42:
CHAPTER ONETHE THEORETICAL FRAMEWOR
- Page 45 and 46:
The successfuldeployment ofthe know
- Page 47 and 48:
The knowledgerevolution atthe end o
- Page 49 and 50:
Technology, theeconomy, andsociety,
- Page 51 and 52:
No one pursuesknowledge forits own
- Page 53 and 54:
The Report adoptsa concept ofknowle
- Page 55 and 56:
The goal of thiscritical review isn
- Page 57 and 58:
In our bidfor economicand humandeve
- Page 59 and 60:
The political reformproject remains
- Page 61 and 62:
Globalisation isdependent oninforma
- Page 63 and 64:
The battle overknowledge in oursoci
- Page 65 and 66:
The most obviousexample of the gapb
- Page 67 and 68:
BOX 1-9The Virtual as an Interrogat
- Page 69 and 70:
The upsurge intechnologicalprowess
- Page 71 and 72:
Collective humaneffort must bedirec
- Page 73 and 74:
End Notes1Epistemic saturation refe
- Page 76 and 77:
CHAPTER TWOARAB KNOWLEDGE PERFORMAN
- Page 78 and 79:
current economic crisis in the autu
- Page 80 and 81:
FIGURE 2-3Perceptions of corruption
- Page 82 and 83:
technology infrastructure, blogs ar
- Page 84 and 85:
nations continue to occupy their pr
- Page 86 and 87:
to the third oil boom, which reache
- Page 88 and 89:
have realised a degree of progress
- Page 90 and 91:
FIGURE 2-8Index of global competiti
- Page 92 and 93:
FIGURE 2-10Net exports of manufactu
- Page 94 and 95:
namely the spread of poverty, socia
- Page 96 and 97:
TABLE 2-2Arab Countries according t
- Page 98 and 99:
while some of these nine countries
- Page 100 and 101:
and political participation. All of
- Page 102 and 103:
first INTEL computer club; INTELis
- Page 104 and 105:
from the ages of thirteen to twenty
- Page 106 and 107:
solutions that allow use of the ava
- Page 108 and 109:
to this trajectory, a consumer, not
- Page 110:
specific cases.These flexibilities
- Page 114 and 115:
CHAPTER THREEEDUCATION AND THE FORM
- Page 116 and 117:
FIGURE 3-1Education and human resou
- Page 118 and 119:
of the qualitative knowledge capita
- Page 120 and 121:
TABLE 3-1CountryOpportunities for b
- Page 122 and 123:
Virtually the only area in which Ar
- Page 124 and 125:
must possess if they aspire to part
- Page 126 and 127:
TABLE 3-2Opportunities for the form
- Page 128 and 129:
General secondary education andthe
- Page 130 and 131:
elatively high enrolment rates of b
- Page 132 and 133:
Available data shows large discrepa
- Page 134 and 135:
TABLE 3-3Comparison of overall resu
- Page 136 and 137:
females. According to this data, to
- Page 138 and 139:
show educational accomplishments am
- Page 140 and 141:
inroads well beyond their current f
- Page 142 and 143:
FIGURE 3-6aMaths performance of eig
- Page 144 and 145:
BOX 3-8The Contribution of Non-Publ
- Page 146 and 147:
Kuwait, and the worst performers su
- Page 148 and 149:
emained encumbered by the prevailin
- Page 150 and 151:
eveal the breadth of the gap that c
- Page 152 and 153:
countries and providing a picture o
- Page 154 and 155:
information systems. The available
- Page 156:
89Finland, for example, whose stude
- Page 160 and 161:
CHAPTER FOURINFORMATION AND COMMUNI
- Page 162 and 163:
FIGURE 4-1ICT index values for Arab
- Page 164 and 165:
countries and the Arab countries. T
- Page 166 and 167:
Arab countries-Egypt, Algeria, Leba
- Page 168 and 169:
of Arabic content and its low rate
- Page 170 and 171:
exchange of future technology servi
- Page 172 and 173:
of national partnerships aimed at s
- Page 174 and 175:
TABLE 4-2Readiness of Arab countrie
- Page 176 and 177:
as the implementation of programmes
- Page 178 and 179:
BOX 4-2Evaluating the Performance o
- Page 180 and 181:
of common principles that guarantee
- Page 182 and 183:
data from various sources and then
- Page 184 and 185:
FIGURE 4-11Paper consumption and in
- Page 186 and 187:
processing and the methods and tool
- Page 188 and 189:
TECHNOLOGICAL ADVANCEAND FUTURE INI
- Page 190 and 191:
within bounds that do not hinder bu
- Page 192 and 193:
preservation and the consolidation
- Page 194 and 195:
21As a result of the nature of comp
- Page 196:
CHAPTER FIVEARAB PERFORMANCE IN RES
- Page 199 and 200:
FIGURE 5-1Innovation system index f
- Page 201 and 202:
The extremely lowamounts spentby Ar
- Page 203 and 204:
It has become clearthat the wager o
- Page 205 and 206:
Joint researchprojects among Arabsc
- Page 207 and 208:
Theoretically, themore researcherst
- Page 209 and 210:
Average expenditureon scientific re
- Page 211 and 212:
BOX 5-6Jordan’s “A Professor in
- Page 213 and 214:
BOX 5-8For the last three decades,
- Page 215 and 216:
FIGURE 5-7Published scientific arti
- Page 217 and 218:
A review of theperiod from 2002to 2
- Page 219 and 220:
Social scienceresearch holds aspeci
- Page 221 and 222:
Most Arabic-languageperiodicals in
- Page 223 and 224:
Arab societies arefilled with examp
- Page 225 and 226: Human capitalis among Arabcountries
- Page 227 and 228: TABLE 5-12Trade in technological pr
- Page 229 and 230: It is ironic thatalthough the Arabw
- Page 231 and 232: End Notes1UNESCO Institute for Stat
- Page 234: CHAPTER SIXBUILDING THE KNOWLEDGE S
- Page 237 and 238: The most conspicuousfeature of thek
- Page 239 and 240: A review of nationalplans in the Ar
- Page 241 and 242: The positiveachievements inthe Arab
- Page 243 and 244: One of the keyfoundations of thevis
- Page 245 and 246: Freedom andinstitutionalisationare
- Page 247 and 248: Priorities are subjectto a great de
- Page 249 and 250: If we admit thatlanguage is avehicl
- Page 251 and 252: The major challengelies in changing
- Page 253 and 254: Deployment is linkedto the creation
- Page 255 and 256: The variousproposals includedin thi
- Page 258 and 259: ReferencesReferences in Arabic‘Ab
- Page 260 and 261: the President of the ICRC Expresses
- Page 262 and 263: al-Duwal al-‘Arabiyya, UNESCO’s
- Page 264 and 265: Sen, Amartya. 1999. Development asF
- Page 266: Castells, Manuel. (1998/2001). LaSo
- Page 269 and 270: the Age of Technology).• Binsa‘
- Page 271 and 272: egional and international levels an
- Page 274 and 275: ANNEX 3. MEASUREMENT OF THE ARABCOU
- Page 278 and 279: countries’ rankings among the cou
- Page 280 and 281: of the Arab countries and suffer fr
- Page 282 and 283: Freedom House and Heritage Institut
- Page 284: Endnotes* This annex was prepared b
- Page 288 and 289: STATISTICAL ANNEXGENERAL INDICATORS
- Page 290 and 291: Table 3: Economic IndicatorsCountry
- Page 292 and 293: KNOWLEDGE PERFORMANCE ENVIRONMENTST
- Page 294 and 295: Table 7: Press Freedom Index in the
- Page 296 and 297: EDUCATIONTable 9: Adult literacy ra
- Page 298 and 299: Table 11: Gross enrolment ratios in
- Page 300 and 301: Table 13: Adult illiterate populati
- Page 302 and 303: Table 16: Net and gross enrolment i
- Page 304 and 305: Table 18: Lessons in basic educatio
- Page 306 and 307: Table 20: Literacy rates among youn
- Page 308 and 309: Table 22: Evolution of enrolment ra
- Page 310 and 311: Table 24: Student enrolment rates i
- Page 312 and 313: Table 26: Distribution of graduates
- Page 314 and 315: Table 28: Estimated educational lev
- Page 316 and 317: Table 30: Enrolment rates in non-go
- Page 318 and 319: RESEARCH AND INNOVATIONTable 32: Nu
- Page 320 and 321: Table 34: Indicators on research an
- Page 322 and 323: INFORMATION AND COMMUNICATION TECHN
- Page 324 and 325: FIGURE b-2Growth in average number
- Page 326 and 327:
competition between the internet se
- Page 328 and 329:
Table c-4: Ranking of a group of Ar
- Page 332:
United Nations Development Programm