NIST Technical Note 1337: Characterization of Clocks and Oscillators
NIST Technical Note 1337: Characterization of Clocks and Oscillators
NIST Technical Note 1337: Characterization of Clocks and Oscillators

You also want an ePaper? Increase the reach of your titles
YUMPU automatically turns print PDFs into web optimized ePapers that Google loves.
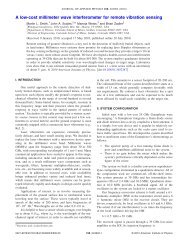
detail elsewhere [12]. The low pass filter sectionis used in order not to saturate the amplifiers withthe carrier feedthrough signal from the mixer. Onedc amplifier is used for phase noise measurementsfrom dc to 100 kHz from the carrier. One acamplifier is used for phase noise measurements from50 kHz to 32 MHz. This range is well matched for one<strong>of</strong> our spectrum analyzers. The wideb<strong>and</strong> ac amplifierhas a b<strong>and</strong>width <strong>of</strong> 50 kHz to 1.3 GHz <strong>and</strong> is used whenthe desired measurement b<strong>and</strong>width exceeds 32 MHz.The wide b<strong>and</strong>width spectrum analyzer also provides aconvenient way to observe the gross features <strong>of</strong> theoutput phase noise <strong>and</strong> to identify any major spuriousoutputs if present. In order to obtain the mostaccurate measurement <strong>of</strong> the phase noise it is,however, necessary to measure the amplitude <strong>of</strong> thefirst IF signal at about 21 MHz in order to avoid thevariations in gains <strong>of</strong> the log amplifiers withvarious enVironmental factors.the beat period <strong>and</strong> pretrigerred at about -2V inorder to accurately determine the slope <strong>of</strong> the outputin volts per radian. This calculation, shown in eq.(23) below, is typically accurate ± 2% or 0.2 dB.K = Volts/Second)(Period/(2~) (23)3) The two sources to be measured are phase lockedtogether with sufficient b<strong>and</strong>width that the phaseexcursions at the mixer are less than 0.1 radian.The necessary phase lock gain is calculated using anestimate for the noise <strong>of</strong> the oscillators <strong>and</strong> thetuning rate for the reference oscillator. This isthen verified by noting the peak to peak excursions<strong>of</strong> the dc amplifier <strong>and</strong> using the measured conversionsensitivity measured in step 2 above. If the peakphase excursions are in excess <strong>of</strong> 0.1 radian, thenthe phase lock loop b<strong>and</strong>width is increased (ifpossible) in order to satisfy this condition.4) The modulator is driven by a reference frequency(typically at +7 to +10 dBm) which steps through theFourier frequencies <strong>of</strong> interest <strong>and</strong> the detected RMSvoltage recorded on the appropriate spectrumanalyzer. This approach accurately yields therelative gains <strong>of</strong> each amplifier <strong>and</strong> its respectivespectrum analyzer since it automatically accounts forthe effect <strong>of</strong> the phase lock loop <strong>and</strong> residualfrequency pulling as well as the termination <strong>of</strong> themixer <strong>and</strong> the variations in gain <strong>of</strong> the variousamplifiers with Fourier frequency. The amplitude <strong>of</strong>the phase modulation on the carrier is constant inamplitude to better than ± 1.5 dB (typically ±0.2dBfor f < 500 MHz) for reference frequencies dc toabout 10' <strong>of</strong> the carrier frequency or a maximum <strong>of</strong> 1GHz. Initial measurements <strong>of</strong> the prototypemodulator are shown in Fig. 14.Fig. 13. Generalized block diagram <strong>of</strong> the new NBSphase noise measurement systems. The phase noise <strong>of</strong>carrier frequencies from 1 MHz to 100 GHz can bemeasured by varying the components in the phaseshifters <strong>and</strong> mixers. Dedicated measurement systemscovering 5 MHz to 50 GHz are described in the text.IV. B Measurement Sequence1) The output power <strong>of</strong> the two sources to bemeasured is typically set to between +5 <strong>and</strong> + 13 dBmat the mixer. This takes into account the insertionloss <strong>of</strong> the phase modulator. If the oscillatorsdon't posses sufficient internal isolation to preventunwanted frequency pulling, isolators (or isolationamplifiers) are generally inserted between thesources <strong>and</strong> the mixer.2) The absolute sensitivity <strong>of</strong> the mixer <strong>and</strong> the dcamplifier for converting small changes in phase tovoltage changes is determined in a way similar to thetraditional method, namely by allowing the twooscillators to slowly beat. The output <strong>of</strong> the dcamplifier is recorded by the digitizer in the FFTconnected to the dc amplifier in order to accuratelydetermine the period <strong>of</strong> the beat. In test sets C <strong>and</strong>D an additional 50 MHz digitizer is used to average<strong>and</strong> record the beat frequency. The time scale <strong>of</strong> thedigitizer is then exp<strong>and</strong>ed to approximately 10' <strong>of</strong>This measurement is then combined with themeasurement <strong>of</strong> the absolute mixer sensitivitymultiplied by the gain <strong>of</strong> the dc amplifier describedin step 2 above. The absolute gain <strong>of</strong> all theamplifiers shown in Fig. 13 can generally bedetermined to an accuracy <strong>of</strong> ± 0.3 dB (1.5 dB forFourier frequencies from 500 MHz to 1 GHz) over theFourier frequencies <strong>of</strong> interest.5) Next the spectral density function <strong>of</strong> the FFT isverified. The level <strong>of</strong> the noise determined by theFFT for the input <strong>of</strong> the noise source amplifiersequentially shorted to ground, connected to groundthrough a 100 kO metal film resister, <strong>and</strong> connectedto ground through 200 pF, is then recorded. Fromthese data one can determine the inherent noisevoltage <strong>and</strong> noise current <strong>of</strong> the noise sourceamplifier plus the FFT as well as the noise <strong>of</strong> theresistor to about ± 0.25 dB which is the statedaccuracy <strong>of</strong> the FFT. This primary calibration <strong>of</strong> theFFT can be carried out from about 20 Hz to over 50kHz. Above 50 kHz, the noise gain <strong>of</strong> the amplifierwe used contributes a significant amount <strong>of</strong> noise.With some compensation the noise is flat to within±0.2 dB from 20 Hz to 100 kHz. Next the noise sourceis switched into the output <strong>of</strong> the mixer <strong>and</strong> therelative noise spectrum <strong>of</strong> all the spectrum analyzersis calibrated by knowing their relative gains. Thisprocedure verifies the voltage references <strong>and</strong> noiseb<strong>and</strong>widths <strong>of</strong> the various spectrum analyzers.6) The noise voltage is recorded on the threespectrum analyzers over the Fourier frequencies <strong>of</strong>interest, generally the same one used in step 4439TN-136