NIST Technical Note 1337: Characterization of Clocks and Oscillators
NIST Technical Note 1337: Characterization of Clocks and Oscillators
NIST Technical Note 1337: Characterization of Clocks and Oscillators

Create successful ePaper yourself
Turn your PDF publications into a flip-book with our unique Google optimized e-Paper software.
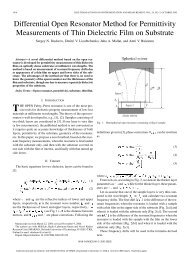
above. The measured noise voltages are scaled usingthe measured gains <strong>and</strong> the spectral density <strong>of</strong> phasenoise calculated. The overlapping ranges <strong>of</strong> thevarious spectrum analyzers allows one the opportunityto compare the measurements on the three spectrumanalyzers, Typically one can obtain S.(f) <strong>of</strong> theoscillator pair to an accuracy <strong>of</strong> about ± 0.6 dB atFourier frequency above 100 Hz. The agreement withrepeat measurements is <strong>of</strong>ten <strong>of</strong> order ± 0.2 dE asshown in Fig. 15.7) The noise floor <strong>of</strong> the system is determined bydriving both sides <strong>of</strong> the measurement system with oneoscillator haVing a similar power <strong>and</strong> impedance levelas that used in these measurements. If the noisefloor is within 13 dB <strong>of</strong> that measured in step 7above, corrections are made to the measurement datato remove the bias generated by the noise floor.Measurements <strong>of</strong> the amplitude accuracy <strong>of</strong> the phasemodulation side b<strong>and</strong>s generated by the prototypephase modulators are summarized in Fig. 15. The samemodulator was used for carrier frequencies from 5 to300 MHz. The error in the phase modulation amplitudeis less than 0.5 dB for modulation frequencies fromdc to 10' <strong>of</strong> the carrier. The 10 GHz modulator alsomaintains an accuracy <strong>of</strong> better than 0.5 dB out to500 KHz from the carrier. At 1 GHz the modulationamplitude is 1.5 dB high. Once this is measured itcan be taken into account in the calibrationprocedure. The 45 GHz modulator results shown inFig. 15 should be attainable over the entire WR22wavequide b<strong>and</strong>Width.The performance that can be obtained with thismeasurement technique is illustrated by actual phasenoise data on oscillator pairs shown in Figs. 15 <strong>and</strong>16. Typical accuracies are ±0.6 dB with a noisefloor at about - 175 dB relative to 1 radian 2 /Hz.The corrections applied to the raw data at 10 GHz areshown in Fig. 17. At low frequencies the effect <strong>of</strong>the phase-locked loop is apparent while at the higherfrequencies the roll-<strong>of</strong>f <strong>of</strong> the amplifiers areimportant. These effects have been emphasized herein order to examine the ability <strong>of</strong> the calibrationprocess to correct for instrumentation gainvariations.V, ConclusionWe have analyzed several traditional approaches tomaking phase measurements <strong>and</strong> found that they alllacked some element necessary for making phase noisemeasurements from essentially dc out to 10, <strong>of</strong> thecarrier frequency with good phase noise floors <strong>and</strong> anaccuracy <strong>of</strong> order 1 dB. By combining several <strong>of</strong> thetechniques <strong>and</strong> adding a phase modulator which isexceptionally flat from dc to about lOt <strong>of</strong> thecarrier frequency, we have been able to achieveexcellent phase noise floors, b<strong>and</strong>widths <strong>of</strong> at leastlOt <strong>of</strong> the carrier, <strong>and</strong> accuracies <strong>of</strong> order ±0.6 dB.1.5m Ll 1.0.!:...g 0.5wc:.Q oI--__.::=----------=:iii"5-g -0.5:ECDtil~ -1.011.-1.5!::--1-_~~-I-_...J--;!;-..l_-L-:_.L---l~:I::-....L._.L-~0,001 0.01 0.1 1 10 100Modulation Frequency (I) in % <strong>of</strong> Carrier FrequencyFig. 14 Measurement <strong>of</strong> the amplitude error <strong>of</strong>modulation signal versus Fourier frequencies f. forthese prototype phase modulators. Curves labeled 5,100, <strong>and</strong> 300 KHz were obtained with the modulatorused in 5 to 1,300 KHz test set. The curve labeled10 GHz was obtained with the modulator for the 2 to26 GHz test set. The curve labeled 45 GHz wasobtained with the WR22 test set.N -136I-NU~2 -138IV.... 11dBal'Uc::- ":9--140tf)Two Oscillator Calibration Test @ 5MHz• System Ax System BA System B + M410 Hz 100 Hz 1kHzI...og Fourier Frequency (HzlFig. 15 Demonstration <strong>of</strong> calibration accuracy fortwo oscillator concept. The curve labeled System Ashows the measured phase noise <strong>of</strong> a pair <strong>of</strong> 5 MHzOSCillators using the test set shown in Fig. 13. Thecurve labeled System B shows the measured phase noise<strong>of</strong> the same pair <strong>of</strong> 5 MHz oscillators using a totallyseparate measurement system with the oscillators heldin phase quadrature with the measurement test set <strong>of</strong>A. The curve labeled System B + ~/4 shows the phasenoise <strong>of</strong> the same pair <strong>of</strong> oscillators using test setB with <strong>and</strong> extra cable length <strong>of</strong> ~/4 inserted intoeach signal path. The agreement between the threecurves is in the worse case ± 0.15 dB.TN-137440