Scientific Concept of the National Cohort (status ... - Nationale Kohorte
Scientific Concept of the National Cohort (status ... - Nationale Kohorte
Scientific Concept of the National Cohort (status ... - Nationale Kohorte

You also want an ePaper? Increase the reach of your titles
YUMPU automatically turns print PDFs into web optimized ePapers that Google loves.
15<br />
A.1 Introduction and overview<br />
Internal boards authorized by <strong>the</strong> general assembly and <strong>the</strong> board <strong>of</strong> directors, as<br />
<strong>the</strong> working group scientific management or <strong>the</strong> use and access committee will be<br />
responsible for particular aspects <strong>of</strong> <strong>the</strong> scientific management (details are provided<br />
in Part B).<br />
A.1.6 Justification <strong>of</strong> sample size requirements<br />
Whenever an epidemiologic study has one single outcome and one single risk factor, <strong>the</strong><br />
sample size necessary to establish a statistically stable association between <strong>the</strong> two is usually<br />
based on statistical power considerations, involving subsequent sample size calculations<br />
for detectable effect size, given type I, II errors, and making reasonable assumptions<br />
on <strong>the</strong> incidence <strong>of</strong> <strong>the</strong> outcome and <strong>the</strong> distribution <strong>of</strong> <strong>the</strong> risk factor. Even in such highly<br />
simplified context, o<strong>the</strong>r, not trivial aspects usually have to be considered, including <strong>the</strong><br />
relevance <strong>of</strong> <strong>the</strong> detectable effect size and various underlying assumptions with respect to<br />
adequacy <strong>of</strong> statistical models 30-32 .<br />
For a project <strong>of</strong> <strong>the</strong> size and breadth <strong>of</strong> scope <strong>of</strong> <strong>the</strong> <strong>National</strong> <strong>Cohort</strong>, developing a notion <strong>of</strong><br />
<strong>the</strong> necessary study size becomes a much more complex exercise. Clearly, considering <strong>the</strong><br />
large number <strong>of</strong> possible disease outcomes and <strong>the</strong> great variety <strong>of</strong> risk factors and related<br />
study hypo<strong>the</strong>ses with respect to <strong>the</strong>se outcomes, <strong>the</strong> problem cannot be defined simply<br />
and thus does not lead to a single and straightforward solution. In addition, financial costs<br />
must also be taken into consideration, for example, with respect to <strong>the</strong> embedded study<br />
levels with intensified phenotyping.<br />
In Sect. A.6 <strong>of</strong> this application, issues related to selecting appropriate forms <strong>of</strong> statistical<br />
modeling are being discussed, and detailed statistical power estimations are presented.<br />
The arguments and estimates laid out in that section indicate that N=200,000 for level 1,<br />
N=40,000 for level 2, and N=40,000 for <strong>the</strong> MRI program, and N=8,000 for <strong>the</strong> combined<br />
measurements <strong>of</strong> level 2 and imaging (as justified in Sect. A.3.4) are reasonable sample<br />
sizes for <strong>the</strong> <strong>National</strong> <strong>Cohort</strong>. Here, we illustrate this in only simplified form by highlighting<br />
<strong>the</strong> sensitivity <strong>of</strong> <strong>the</strong> study in different incidence scenarios. This simplicity results from<br />
<strong>the</strong> simple model we consider here, namely, that <strong>of</strong> a quantitative trait that is divided into<br />
quartiles, where <strong>the</strong> measure <strong>of</strong> sensitivity is expressed as <strong>the</strong> RR that may be detected by<br />
contrasting <strong>the</strong> 4th versus <strong>the</strong> 1st quartile <strong>of</strong> <strong>the</strong> trait for a significance level <strong>of</strong> 5%, power <strong>of</strong><br />
80%, two-sided test, given a certain number <strong>of</strong> events in <strong>the</strong> full cohort (Level 1).<br />
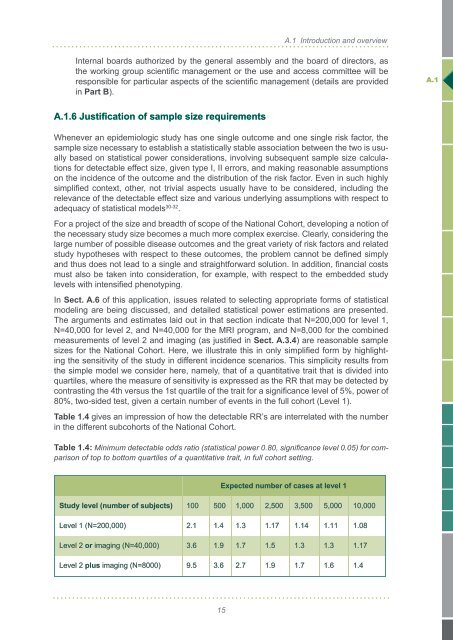
Table 1.4 gives an impression <strong>of</strong> how <strong>the</strong> detectable RR’s are interrelated with <strong>the</strong> number<br />
in <strong>the</strong> different subcohorts <strong>of</strong> <strong>the</strong> <strong>National</strong> <strong>Cohort</strong>.<br />
Table 1.4: Minimum detectable odds ratio (statistical power 0.80, significance level 0.05) for comparison<br />
<strong>of</strong> top to bottom quartiles <strong>of</strong> a quantitative trait, in full cohort setting.<br />
Expected number <strong>of</strong> cases at level 1<br />
Study level (number <strong>of</strong> subjects) 100 500 1,000 2,500 3,500 5,000 10,000<br />
Level 1 (N=200,000) 2.1 1.4 1.3 1.17 1.14 1.11 1.08<br />
Level 2 or imaging (N=40,000) 3.6 1.9 1.7 1.5 1.3 1.3 1.17<br />
Level 2 plus imaging (N=8000) 9.5 3.6 2.7 1.9 1.7 1.6 1.4<br />
A.1