Is headspace making a difference to young people’s lives?
Evaluation-of-headspace-program
Evaluation-of-headspace-program
Create successful ePaper yourself
Turn your PDF publications into a flip-book with our unique Google optimized e-Paper software.
Appendix B<br />
The assumptions described are implicit in the current expansion model as defined by the Department<br />
of Health, as there is little scope for hNO <strong>to</strong> vary the dollar allocation <strong>to</strong> centres based on higher<br />
costs of doing business in particular areas. That is, the current centre allocation model is constrained<br />
<strong>to</strong> an average of $842,000 per centre with a range of $600,000 per annum <strong>to</strong> $1,100,000 per annum<br />
for fully operational centres.<br />
There may be some capacity at hNO <strong>to</strong> vary the funding made available <strong>to</strong> individual centres (so long<br />
as the overall average of $842,000 per centre is maintained). For example, greater lead agency input<br />
can supplement the overall cost of running any given <strong>headspace</strong> centre. However, this information<br />
was not available <strong>to</strong> the evalua<strong>to</strong>rs nor were the individual funding agreements with individual<br />
centres. Therefore, for the purpose of this evaluation, centre allocation and costing is based on<br />
<strong>headspace</strong> grant costs alone. Note that for the reference period of the evaluation costs data for some<br />
remote centres such as Mt. <strong>Is</strong>a were out of scope. The focus is on fully operational (Rounds 1-4)<br />
centres.<br />
While the extent of model flexibility <strong>to</strong> tailor costs <strong>to</strong> parameters such as rurality is not possible <strong>to</strong><br />
evaluate due <strong>to</strong> data availability, this is a significant fac<strong>to</strong>r for expansion beyond 100 centres, as<br />
new centres will be located disproportionally in non-urban and remote areas in comparison with the<br />
geographic distribution of centre allocation for the first 100 centres.<br />
This issue also bears closer consideration for centres currently in existence. For example, a number<br />
of <strong>headspace</strong> centres in highly urbanised areas (i.e. Camperdown, Collingwood and Parramatta)<br />
have youth populations of over 100,000 within a 10 km radius, whereas a number of regional<br />
<strong>headspace</strong> centres have <strong>to</strong>tal service populations of less than 5,000 within 10 km. That is, potential<br />
service populations within 10 km of some urban <strong>headspace</strong> centres can be twenty times greater<br />
than some regional centres. However, the current funding model is quite tightly constrained, and<br />
these centres receive broadly equivalent funding despite the wide variation in size of their respective<br />
service populations. The allocation of centres <strong>to</strong> regional locations reflects a number of fac<strong>to</strong>rs,<br />
including equity of access and potentially greater need per capita, but these inequalities suggest a<br />
need for closer examination of the current centre allocation and funding models.<br />
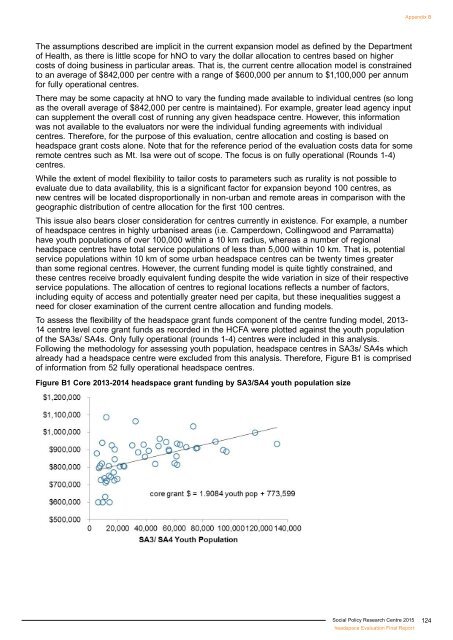
To assess the flexibility of the <strong>headspace</strong> grant funds component of the centre funding model, 2013-<br />
14 centre level core grant funds as recorded in the HCFA were plotted against the youth population<br />
of the SA3s/ SA4s. Only fully operational (rounds 1-4) centres were included in this analysis.<br />
Following the methodology for assessing youth population, <strong>headspace</strong> centres in SA3s/ SA4s which<br />
already had a <strong>headspace</strong> centre were excluded from this analysis. Therefore, Figure B1 is comprised<br />
of information from 52 fully operational <strong>headspace</strong> centres.<br />
Figure B1 Core 2013-2014 <strong>headspace</strong> grant funding by SA3/SA4 youth population size<br />
Social Policy Research Centre 2015<br />
<strong>headspace</strong> Evaluation Final Report<br />
124


