

Is headspace making a difference to young people’s lives?
Evaluation-of-headspace-program
Evaluation-of-headspace-program

Create successful ePaper yourself
Turn your PDF publications into a flip-book with our unique Google optimized e-Paper software.
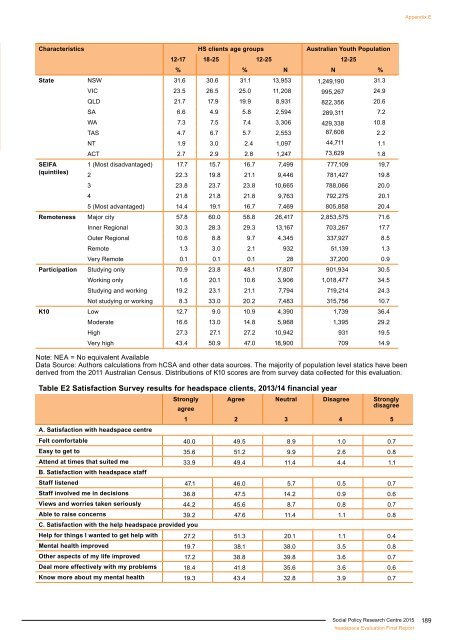
Appendix E<br />
Characteristics HS clients age groups Australian Youth Population<br />
12-17 18-25 12-25 12-25<br />
% % N N %<br />
State NSW 31.6 30.6 31.1 13,953 1,249,190 31.3<br />
VIC 23.5 26.5 25.0 11,208 995,267 24.9<br />
QLD 21.7 17.9 19.9 8,931 822,356 20.6<br />
SA 6.6 4.9 5.8 2,594 289,311 7.2<br />
WA 7.3 7.5 7.4 3,306 429,338 10.8<br />
TAS 4.7 6.7 5.7 2,553 87,608 2.2<br />
NT 1.9 3.0 2.4 1,097 44,711 1.1<br />
ACT 2.7 2.9 2.8 1,247 73,629 1.8<br />
SEIFA<br />
1 (Most disadvantaged) 17.7 15.7 16.7 7,499 777,109 19.7<br />
(quintiles)<br />
2 22.3 19.8 21.1 9,446 781,427 19.8<br />
3 23.8 23.7 23.8 10,665 788,066 20.0<br />
4 21.8 21.8 21.8 9,763 792,275 20.1<br />
5 (Most advantaged) 14.4 19.1 16.7 7,469 805,858 20.4<br />
Remoteness Major city 57.8 60.0 58.8 26,417 2,853,575 71.6<br />
Inner Regional 30.3 28.3 29.3 13,167 703,267 17.7<br />
Outer Regional 10.6 8.8 9.7 4,345 337,927 8.5<br />
Remote 1.3 3.0 2.1 932 51,139 1.3<br />
Very Remote 0.1 0.1 0.1 28 37,200 0.9<br />
Participation Studying only 70.9 23.8 48.1 17,807 901,934 30.5<br />
Working only 1.6 20.1 10.6 3,906 1,018,477 34.5<br />
Studying and working 19.2 23.1 21.1 7,794 719,214 24.3<br />
Not studying or working 8.3 33.0 20.2 7,483 315,756 10.7<br />
K10 Low 12.7 9.0 10.9 4,390 1,739 36.4<br />
Moderate 16.6 13.0 14.8 5,968 1,395 29.2<br />
High 27.3 27.1 27.2 10,942 931 19.5<br />
Very high 43.4 50.9 47.0 18,900 709 14.9<br />
Note: NEA = No equivalent Available<br />
Data Source: Authors calculations from hCSA and other data sources. The majority of population level statics have been<br />
derived from the 2011 Australian Census. Distributions of K10 scores are from survey data collected for this evaluation.<br />
Table E2 Satisfaction Survey results for <strong>headspace</strong> clients, 2013/14 financial year<br />
Strongly<br />
agree<br />
Agree Neutral Disagree Strongly<br />
disagree<br />
1 2 3 4 5<br />
A. Satisfaction with <strong>headspace</strong> centre<br />
Felt comfortable 40.0 49.5 8.9 1.0 0.7<br />
Easy <strong>to</strong> get <strong>to</strong> 35.6 51.2 9.9 2.6 0.8<br />
Attend at times that suited me 33.9 49.4 11.4 4.4 1.1<br />
B. Satisfaction with <strong>headspace</strong> staff<br />
Staff listened 47.1 46.0 5.7 0.5 0.7<br />
Staff involved me in decisions 36.8 47.5 14.2 0.9 0.6<br />
Views and worries taken seriously 44.2 45.6 8.7 0.8 0.7<br />
Able <strong>to</strong> raise concerns 39.2 47.6 11.4 1.1 0.8<br />
C. Satisfaction with the help <strong>headspace</strong> provided you<br />
Help for things I wanted <strong>to</strong> get help with 27.2 51.3 20.1 1.1 0.4<br />
Mental health improved 19.7 38.1 38.0 3.5 0.8<br />
Other aspects of my life improved 17.2 38.8 39.8 3.6 0.7<br />
Deal more effectively with my problems 18.4 41.8 35.6 3.6 0.6<br />
Know more about my mental health 19.3 43.4 32.8 3.9 0.7<br />
Social Policy Research Centre 2015<br />
<strong>headspace</strong> Evaluation Final Report<br />
189