

Is headspace making a difference to young people’s lives?
Evaluation-of-headspace-program
Evaluation-of-headspace-program

Create successful ePaper yourself
Turn your PDF publications into a flip-book with our unique Google optimized e-Paper software.
Appendix B<br />
Census analysis of distance <strong>to</strong> <strong>headspace</strong> centres<br />
Method<br />
Based on the shape of the curve in Figure B6, living within 10 km and 30 km from an existing<br />
<strong>headspace</strong> centre were selected as points which represented a substantial decline in use and<br />
knowledge of <strong>headspace</strong> services. Therefore, for the purpose of further analysis, these points were<br />
used <strong>to</strong> define access.<br />
Centre locations<br />
Using this definition of access, which assumes those living within close proximity <strong>to</strong> a <strong>headspace</strong><br />
centre are able <strong>to</strong> make use of services when required, the number of <strong>young</strong> people living within 10<br />
and 30 km of all existing centre locations allocated up <strong>to</strong> Round 8 was assessed. While the YMM<br />
analysis described in the preceding section used location information for centres assigned in Rounds<br />
1 <strong>to</strong> 4 due <strong>to</strong> the timing of survey data collection, the present analysis was based in the hCSA and<br />
was therefore able <strong>to</strong> use centre location for those assigned in Rounds 1 – 8. This analysis made<br />
use of the 2011 census of population and housing usual resident population data. Point locations<br />
for established centres were geocoded. In the case of funded centres which have not yet been<br />
established in Rounds 7 and 8, exact centre location is not yet known. However, the postcode<br />
in which these centres will be located is available. Therefore, likely centre location within the<br />
postcode area was estimated, and this point was geocoded. Additionally, for centres allocated in the<br />
hypothetical Rounds 9 <strong>to</strong> 14, which were determined based on the current model of centre allocation,<br />
a location was estimated. As these centres were allocated at the SA3 or SA4 level, which in some<br />
cases cover substantial areas, the centroid of the most highly populated SA1 within the selected area<br />
was used <strong>to</strong> provide a proxy centre location. As a result, the interpretation of the findings for Rounds<br />
9 <strong>to</strong> 14 should be undertaken with some caution.<br />
Distance <strong>to</strong> centres<br />
The proportion of the youth population living less than 10 kilometres from a <strong>headspace</strong> centre, within<br />
a 10-30 kilometres radius of a centre, and those who were living further than 30 kilometres from a<br />
centre was determined using census population data. Distance from each <strong>headspace</strong> centre was<br />
based on the geocoded location of the <strong>headspace</strong> centre and the geographic centroid of every SA1<br />
in Australia. Some SA1s in remote areas are large, and use of the centroid as a proxy location for<br />
certain remote SA1s can result in some errors.<br />
Results<br />
Distance <strong>to</strong> <strong>headspace</strong> centre based on current centre allocation<br />
At the completion of Round 8 approximately two thirds of <strong>young</strong> people aged 12-25 years will live<br />
within 10 kilometres of a <strong>headspace</strong> centre, with the proportion of <strong>young</strong> men being very similar <strong>to</strong><br />
that of <strong>young</strong> women (Table B4 and Table B5). Only 12.5% will live further than 30 kilometres from a<br />
centre.<br />
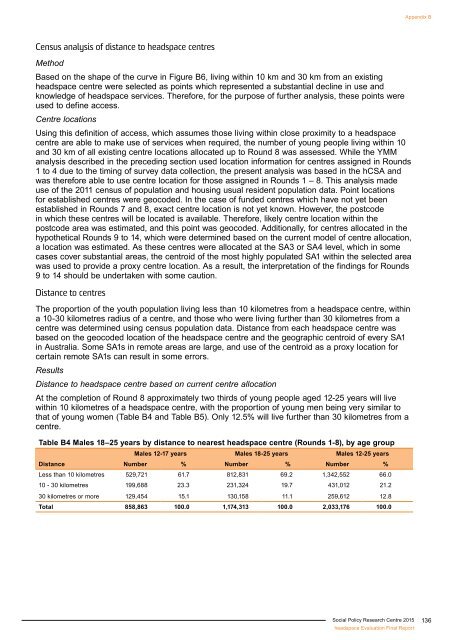
Table B4 Males 18–25 years by distance <strong>to</strong> nearest <strong>headspace</strong> centre (Rounds 1-8), by age group<br />
Males 12-17 years Males 18-25 years Males 12-25 years<br />
Distance Number % Number % Number %<br />
Less than 10 kilometres 529,721 61.7 812,831 69.2 1,342,552 66.0<br />
10 - 30 kilometres 199,688 23.3 231,324 19.7 431,012 21.2<br />
30 kilometres or more 129,454 15.1 130,158 11.1 259,612 12.8<br />
Total 858,863 100.0 1,174,313 100.0 2,033,176 100.0<br />
Social Policy Research Centre 2015<br />
<strong>headspace</strong> Evaluation Final Report<br />
136