

Is headspace making a difference to young people’s lives?
Evaluation-of-headspace-program
Evaluation-of-headspace-program

Create successful ePaper yourself
Turn your PDF publications into a flip-book with our unique Google optimized e-Paper software.
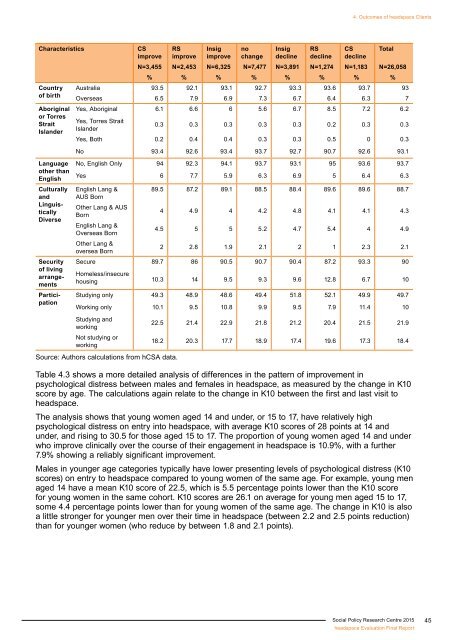
4. Outcomes of <strong>headspace</strong> Clients<br />
Characteristics<br />
Country<br />
of birth<br />
Aboriginal<br />
or Torres<br />
Strait<br />
<strong>Is</strong>lander<br />
CS<br />
improve<br />
RS<br />
improve<br />
Insig<br />
improve<br />
no<br />
change<br />
Insig<br />
decline<br />
RS<br />
decline<br />
CS<br />
decline<br />
N=3,455 N=2,453 N=6,325 N=7,477 N=3,891 N=1,274 N=1,183 N=26,058<br />
% % % % % % % %<br />
Australia 93.5 92.1 93.1 92.7 93.3 93.6 93.7 93<br />
Overseas 6.5 7.9 6.9 7.3 6.7 6.4 6.3 7<br />
Yes, Aboriginal 6.1 6.6 6 5.6 6.7 8.5 7.2 6.2<br />
Yes, Torres Strait<br />
<strong>Is</strong>lander<br />
0.3 0.3 0.3 0.3 0.3 0.2 0.3 0.3<br />
Yes, Both 0.2 0.4 0.4 0.3 0.3 0.5 0 0.3<br />
No 93.4 92.6 93.4 93.7 92.7 90.7 92.6 93.1<br />
Total<br />
Language<br />
other than<br />
English<br />
Culturally<br />
and<br />
Linguistically<br />
Diverse<br />
Security<br />
of living<br />
arrangements<br />
Participation<br />
No, English Only 94 92.3 94.1 93.7 93.1 95 93.6 93.7<br />
Yes 6 7.7 5.9 6.3 6.9 5 6.4 6.3<br />
English Lang &<br />
AUS Born<br />
Other Lang & AUS<br />
Born<br />
English Lang &<br />
Overseas Born<br />
89.5 87.2 89.1 88.5 88.4 89.6 89.6 88.7<br />
4 4.9 4 4.2 4.8 4.1 4.1 4.3<br />
4.5 5 5 5.2 4.7 5.4 4 4.9<br />
Other Lang &<br />
oversea Born<br />
2 2.8 1.9 2.1 2 1 2.3 2.1<br />
Secure 89.7 86 90.5 90.7 90.4 87.2 93.3 90<br />
Homeless/insecure<br />
housing 10.3 14 9.5 9.3 9.6 12.8 6.7 10<br />
Studying only 49.3 48.9 48.6 49.4 51.8 52.1 49.9 49.7<br />
Working only 10.1 9.5 10.8 9.9 9.5 7.9 11.4 10<br />
Studying and<br />
working<br />
Not studying or<br />
working<br />
Source: Authors calculations from hCSA data.<br />
22.5 21.4 22.9 21.8 21.2 20.4 21.5 21.9<br />
18.2 20.3 17.7 18.9 17.4 19.6 17.3 18.4<br />
Table 4.3 shows a more detailed analysis of <strong>difference</strong>s in the pattern of improvement in<br />
psychological distress between males and females in <strong>headspace</strong>, as measured by the change in K10<br />
score by age. The calculations again relate <strong>to</strong> the change in K10 between the first and last visit <strong>to</strong><br />
<strong>headspace</strong>.<br />
The analysis shows that <strong>young</strong> women aged 14 and under, or 15 <strong>to</strong> 17, have relatively high<br />
psychological distress on entry in<strong>to</strong> <strong>headspace</strong>, with average K10 scores of 28 points at 14 and<br />
under, and rising <strong>to</strong> 30.5 for those aged 15 <strong>to</strong> 17. The proportion of <strong>young</strong> women aged 14 and under<br />
who improve clinically over the course of their engagement in <strong>headspace</strong> is 10.9%, with a further<br />
7.9% showing a reliably significant improvement.<br />
Males in <strong>young</strong>er age categories typically have lower presenting levels of psychological distress (K10<br />
scores) on entry <strong>to</strong> <strong>headspace</strong> compared <strong>to</strong> <strong>young</strong> women of the same age. For example, <strong>young</strong> men<br />
aged 14 have a mean K10 score of 22.5, which is 5.5 percentage points lower than the K10 score<br />
for <strong>young</strong> women in the same cohort. K10 scores are 26.1 on average for <strong>young</strong> men aged 15 <strong>to</strong> 17,<br />
some 4.4 percentage points lower than for <strong>young</strong> women of the same age. The change in K10 is also<br />
a little stronger for <strong>young</strong>er men over their time in <strong>headspace</strong> (between 2.2 and 2.5 points reduction)<br />
than for <strong>young</strong>er women (who reduce by between 1.8 and 2.1 points).<br />
Social Policy Research Centre 2015<br />
<strong>headspace</strong> Evaluation Final Report<br />
45