

Is headspace making a difference to young people’s lives?
Evaluation-of-headspace-program
Evaluation-of-headspace-program

You also want an ePaper? Increase the reach of your titles
YUMPU automatically turns print PDFs into web optimized ePapers that Google loves.
3. Access and Engagement with Centres<br />
Social and occupational functioning<br />
Young people attending <strong>headspace</strong> aged 12-17 years were most likely <strong>to</strong> be in education only<br />
(70.9%) or studying and working (19.2%). A small number (1.6%) were working only, and 8.3% were<br />
neither in education nor work. Older <strong>young</strong> people (18-25 year olds) were much more likely <strong>to</strong> be<br />
disengaged from economic participation. One in three were neither studying nor working (33%). Of<br />
the remaining 18-25 year olds, 23.8% were studying only, 20.1% were working only, and 23.1% were<br />
studying and working.<br />
Despite the majority of <strong>young</strong> people still being engaged in education and/or work, most <strong>young</strong><br />
people (60.2%) on first presentation <strong>to</strong> <strong>headspace</strong> had at least some difficulty in social, occupational<br />
or educational functioning (as scored by practitioners using the Social and Occupational Functioning<br />
Assessment Score, SOFAS) 21 . According <strong>to</strong> the SOFAS assessment on first presentation, around<br />
one in four <strong>young</strong> people had a serious impairment in functioning, 13.6% had no more than a slight<br />
impairment, 1.9% were experiencing an inability <strong>to</strong> function in almost all areas, and 0.1% were not<br />
maintaining minimal personal hygiene.<br />
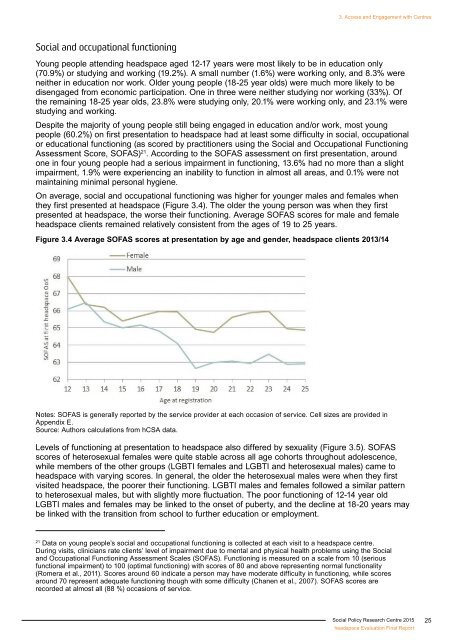
On average, social and occupational functioning was higher for <strong>young</strong>er males and females when<br />
they first presented at <strong>headspace</strong> (Figure 3.4). The older the <strong>young</strong> person was when they first<br />
presented at <strong>headspace</strong>, the worse their functioning. Average SOFAS scores for male and female<br />
<strong>headspace</strong> clients remained relatively consistent from the ages of 19 <strong>to</strong> 25 years.<br />
Figure 3.4 Average SOFAS scores at presentation by age and gender, <strong>headspace</strong> clients 2013/14<br />
Notes: SOFAS is generally reported by the service provider at each occasion of service. Cell sizes are provided in<br />
Appendix E.<br />
Source: Authors calculations from hCSA data.<br />
Levels of functioning at presentation <strong>to</strong> <strong>headspace</strong> also differed by sexuality (Figure 3.5). SOFAS<br />
scores of heterosexual females were quite stable across all age cohorts throughout adolescence,<br />
while members of the other groups (LGBTI females and LGBTI and heterosexual males) came <strong>to</strong><br />
<strong>headspace</strong> with varying scores. In general, the older the heterosexual males were when they first<br />
visited <strong>headspace</strong>, the poorer their functioning. LGBTI males and females followed a similar pattern<br />
<strong>to</strong> heterosexual males, but with slightly more fluctuation. The poor functioning of 12-14 year old<br />
LGBTI males and females may be linked <strong>to</strong> the onset of puberty, and the decline at 18-20 years may<br />
be linked with the transition from school <strong>to</strong> further education or employment.<br />
21<br />
Data on <strong>young</strong> <strong>people’s</strong> social and occupational functioning is collected at each visit <strong>to</strong> a <strong>headspace</strong> centre.<br />
During visits, clinicians rate clients’ level of impairment due <strong>to</strong> mental and physical health problems using the Social<br />
and Occupational Functioning Assessment Scales (SOFAS). Functioning is measured on a scale from 10 (serious<br />
functional impairment) <strong>to</strong> 100 (optimal functioning) with scores of 80 and above representing normal functionality<br />
(Romera et al., 2011). Scores around 60 indicate a person may have moderate difficulty in functioning, while scores<br />
around 70 represent adequate functioning though with some difficulty (Chanen et al., 2007). SOFAS scores are<br />
recorded at almost all (88 %) occasions of service.<br />
Social Policy Research Centre 2015<br />
<strong>headspace</strong> Evaluation Final Report<br />
25