

Is headspace making a difference to young people’s lives?
Evaluation-of-headspace-program
Evaluation-of-headspace-program

You also want an ePaper? Increase the reach of your titles
YUMPU automatically turns print PDFs into web optimized ePapers that Google loves.
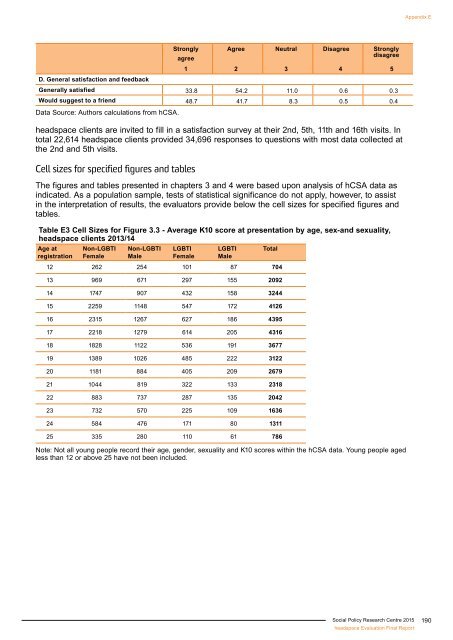
Appendix E<br />
Strongly<br />
agree<br />
Agree Neutral Disagree Strongly<br />
disagree<br />
1 2 3 4 5<br />
D. General satisfaction and feedback<br />
Generally satisfied 33.8 54.2 11.0 0.6 0.3<br />
Would suggest <strong>to</strong> a friend 48.7 41.7 8.3 0.5 0.4<br />
Data Source: Authors calculations from hCSA.<br />
<strong>headspace</strong> clients are invited <strong>to</strong> fill in a satisfaction survey at their 2nd, 5th, 11th and 16th visits. In<br />
<strong>to</strong>tal 22,614 <strong>headspace</strong> clients provided 34,696 responses <strong>to</strong> questions with most data collected at<br />
the 2nd and 5th visits.<br />
Cell sizes for specified figures and tables<br />
The figures and tables presented in chapters 3 and 4 were based upon analysis of hCSA data as<br />
indicated. As a population sample, tests of statistical significance do not apply, however, <strong>to</strong> assist<br />
in the interpretation of results, the evalua<strong>to</strong>rs provide below the cell sizes for specified figures and<br />
tables.<br />
Table E3 Cell Sizes for Figure 3.3 - Average K10 score at presentation by age, sex-and sexuality,<br />
<strong>headspace</strong> clients 2013/14<br />
Age at<br />
registration<br />
Non-LGBTI<br />
Female<br />
Non-LGBTI<br />
Male<br />
LGBTI<br />
Female<br />
LGBTI<br />
Male<br />
Total<br />
12 262 254 101 87 704<br />
13 969 671 297 155 2092<br />
14 1747 907 432 158 3244<br />
15 2259 1148 547 172 4126<br />
16 2315 1267 627 186 4395<br />
17 2218 1279 614 205 4316<br />
18 1828 1122 536 191 3677<br />
19 1389 1026 485 222 3122<br />
20 1181 884 405 209 2679<br />
21 1044 819 322 133 2318<br />
22 883 737 287 135 2042<br />
23 732 570 225 109 1636<br />
24 584 476 171 80 1311<br />
25 335 280 110 61 786<br />
Note: Not all <strong>young</strong> people record their age, gender, sexuality and K10 scores within the hCSA data. Young people aged<br />
less than 12 or above 25 have not been included.<br />
Social Policy Research Centre 2015<br />
<strong>headspace</strong> Evaluation Final Report<br />
190