

Is headspace making a difference to young people’s lives?
Evaluation-of-headspace-program
Evaluation-of-headspace-program

Create successful ePaper yourself
Turn your PDF publications into a flip-book with our unique Google optimized e-Paper software.
Appendix G<br />
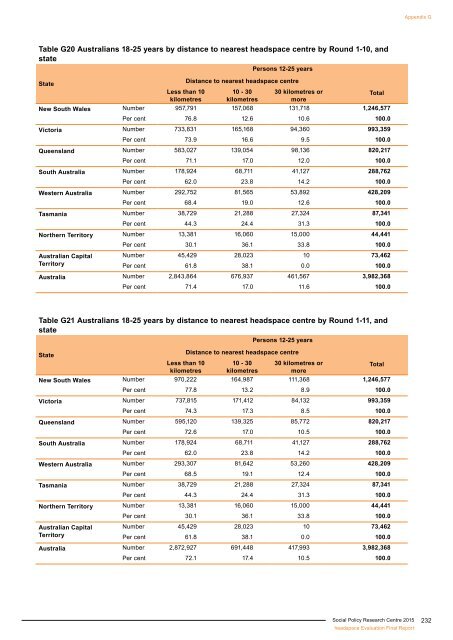
Table G20 Australians 18-25 years by distance <strong>to</strong> nearest <strong>headspace</strong> centre by Round 1-10, and<br />
state<br />
Persons 12-25 years<br />
State<br />
Distance <strong>to</strong> nearest <strong>headspace</strong> centre<br />
Less than 10<br />
kilometres<br />
10 - 30<br />
kilometres<br />
30 kilometres or<br />
more<br />
New South Wales Number 957,791 157,068 131,718 1,246,577<br />
Per cent 76.8 12.6 10.6 100.0<br />
Vic<strong>to</strong>ria Number 733,831 165,168 94,360 993,359<br />
Per cent 73.9 16.6 9.5 100.0<br />
Queensland Number 583,027 139,054 98,136 820,217<br />
Per cent 71.1 17.0 12.0 100.0<br />
South Australia Number 178,924 68,711 41,127 288,762<br />
Per cent 62.0 23.8 14.2 100.0<br />
Western Australia Number 292,752 81,565 53,892 428,209<br />
Per cent 68.4 19.0 12.6 100.0<br />
Tasmania Number 38,729 21,288 27,324 87,341<br />
Per cent 44.3 24.4 31.3 100.0<br />
Northern Terri<strong>to</strong>ry Number 13,381 16,060 15,000 44,441<br />
Per cent 30.1 36.1 33.8 100.0<br />
Total<br />
Australian Capital<br />
Terri<strong>to</strong>ry<br />
Number 45,429 28,023 10 73,462<br />
Per cent 61.8 38.1 0.0 100.0<br />
Australia Number 2,843,864 676,937 461,567 3,982,368<br />
Per cent 71.4 17.0 11.6 100.0<br />
Table G21 Australians 18-25 years by distance <strong>to</strong> nearest <strong>headspace</strong> centre by Round 1-11, and<br />
state<br />
Persons 12-25 years<br />
State<br />
Distance <strong>to</strong> nearest <strong>headspace</strong> centre<br />
Less than 10<br />
kilometres<br />
10 - 30<br />
kilometres<br />
30 kilometres or<br />
more<br />
New South Wales Number 970,222 164,987 111,368 1,246,577<br />
Per cent 77.8 13.2 8.9 100.0<br />
Vic<strong>to</strong>ria Number 737,815 171,412 84,132 993,359<br />
Per cent 74.3 17.3 8.5 100.0<br />
Queensland Number 595,120 139,325 85,772 820,217<br />
Per cent 72.6 17.0 10.5 100.0<br />
South Australia Number 178,924 68,711 41,127 288,762<br />
Per cent 62.0 23.8 14.2 100.0<br />
Western Australia Number 293,307 81,642 53,260 428,209<br />
Per cent 68.5 19.1 12.4 100.0<br />
Tasmania Number 38,729 21,288 27,324 87,341<br />
Per cent 44.3 24.4 31.3 100.0<br />
Northern Terri<strong>to</strong>ry Number 13,381 16,060 15,000 44,441<br />
Per cent 30.1 36.1 33.8 100.0<br />
Total<br />
Australian Capital<br />
Terri<strong>to</strong>ry<br />
Number 45,429 28,023 10 73,462<br />
Per cent 61.8 38.1 0.0 100.0<br />
Australia Number 2,872,927 691,448 417,993 3,982,368<br />
Per cent 72.1 17.4 10.5 100.0<br />
Social Policy Research Centre 2015<br />
<strong>headspace</strong> Evaluation Final Report<br />
232