

Is headspace making a difference to young people’s lives?
Evaluation-of-headspace-program
Evaluation-of-headspace-program

Create successful ePaper yourself
Turn your PDF publications into a flip-book with our unique Google optimized e-Paper software.
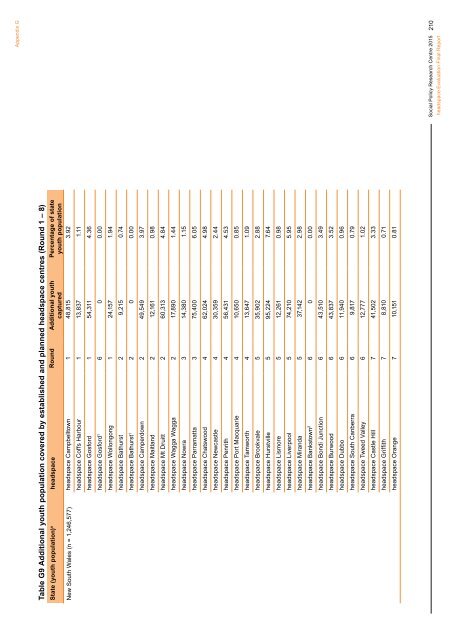
Table G9 Additional youth population covered by established and planned <strong>headspace</strong> centres (Round 1 – 8)<br />
State (youth population) a <strong>headspace</strong> Round Additional youth<br />
captured<br />
Percentage of state<br />
youth population<br />
New South Wales (n = 1,246,577) <strong>headspace</strong> Campbell<strong>to</strong>wn 1 48,815 3.92<br />
<strong>headspace</strong> Coffs Harbour 1 13,837 1.11<br />
<strong>headspace</strong> Gosford 1 54,311 4.36<br />
<strong>headspace</strong> Gosford 1 6 0 0.00<br />
<strong>headspace</strong> Wollongong 1 24,157 1.94<br />
<strong>headspace</strong> Bathurst 2 9,215 0.74<br />
<strong>headspace</strong> Bathurst 1 2 0 0.00<br />
<strong>headspace</strong> Camperdown 2 49,549 3.97<br />
<strong>headspace</strong> Maitland 2 12,161 0.98<br />
<strong>headspace</strong> Mt Druitt 2 60,313 4.84<br />
<strong>headspace</strong> Wagga Wagga 2 17,890 1.44<br />
<strong>headspace</strong> Nowra 3 14,380 1.15<br />
<strong>headspace</strong> Parramatta 3 75,400 6.05<br />
<strong>headspace</strong> Chatswood 4 62,024 4.98<br />
<strong>headspace</strong> Newcastle 4 30,359 2.44<br />
<strong>headspace</strong> Penrith 4 56,431 4.53<br />
<strong>headspace</strong> Port Macquarie 4 10,650 0.85<br />
<strong>headspace</strong> Tamworth 4 13,647 1.09<br />
<strong>headspace</strong> Brookvale 5 35,902 2.88<br />
<strong>headspace</strong> Hurstville 5 95,224 7.64<br />
<strong>headspace</strong> Lismore 5 12,261 0.98<br />
<strong>headspace</strong> Liverpool 5 74,210 5.95<br />
<strong>headspace</strong> Miranda 5 37,142 2.98<br />
<strong>headspace</strong> Banks<strong>to</strong>wn 2 6 0 0.00<br />
<strong>headspace</strong> Bondi Junction 6 43,510 3.49<br />
<strong>headspace</strong> Burwood 6 43,837 3.52<br />
<strong>headspace</strong> Dubbo 6 11,940 0.96<br />
<strong>headspace</strong> South Canberra 6 9,817 0.79<br />
<strong>headspace</strong> Tweed Valley 6 12,777 1.02<br />
<strong>headspace</strong> Castle Hill 7 41,502 3.33<br />
<strong>headspace</strong> Griffith 7 8,810 0.71<br />
<strong>headspace</strong> Orange 7 10,151 0.81<br />
Appendix G<br />
Social Policy Research Centre 2015<br />
<strong>headspace</strong> Evaluation Final Report<br />
210