

Is headspace making a difference to young people’s lives?
Evaluation-of-headspace-program
Evaluation-of-headspace-program

Create successful ePaper yourself
Turn your PDF publications into a flip-book with our unique Google optimized e-Paper software.
Appendix B<br />
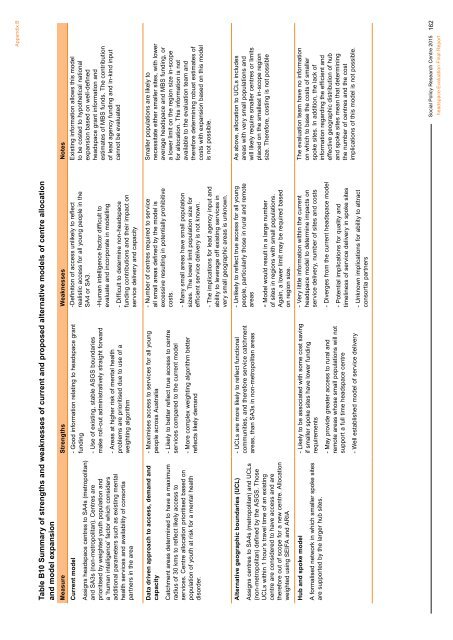
Table B10 Summary of strengths and weaknesses of current and proposed alternative models of centre allocation<br />
and model expansion<br />
Measure Strengths Weaknesses Notes<br />
Current model<br />
Assigns <strong>headspace</strong> centres <strong>to</strong> SA4s (metropolitan)<br />
and SA3s (non-metropolitan). Centres are<br />
prioritised by weighted youth population and<br />
a ‘human intelligence’ fac<strong>to</strong>r which considers<br />
additional parameters such as existing mental<br />
health services and availability of consortia<br />
partners in the area<br />
- Good information relating <strong>to</strong> <strong>headspace</strong> grant<br />
funding<br />
- Use of existing, stable ASGS boundaries<br />
make roll-out administratively straight forward<br />
- Areas at higher risk of mental health<br />
problems are prioritised due <strong>to</strong> use of a<br />
weighting algorithm<br />
-Definition of access unlikely <strong>to</strong> reflect<br />
realistic access for all <strong>young</strong> people in the<br />
SA4 or SA3.<br />
-Human intelligence fac<strong>to</strong>r difficult <strong>to</strong><br />
evaluate and incorporate in modelling<br />
- Difficult <strong>to</strong> determine non-<strong>headspace</strong><br />
funding contributions and their impact on<br />
service delivery and capacity<br />
Existing information allows this model<br />
<strong>to</strong> be costed <strong>to</strong> hypothetical national<br />
expansion based on well-defined<br />
<strong>headspace</strong> grant information and<br />
estimates of MBS funds. The contribution<br />
of lead agency funding and in-kind input<br />
cannot be evaluated<br />
Data driven approach <strong>to</strong> access, demand and<br />
capacity<br />
Catchment areas determined <strong>to</strong> have a maximum<br />
radius of 30 kms <strong>to</strong> reflect likely access <strong>to</strong><br />
services. Centre allocation prioritised based on<br />
population of youth at risk for a mental health<br />
disorder.<br />
- Maximises access <strong>to</strong> services for all <strong>young</strong><br />
people across Australia<br />
- Likely <strong>to</strong> better reflect true access <strong>to</strong> centre<br />
services compared <strong>to</strong> the current model<br />
- More complex weighting algorithm better<br />
reflects likely demand<br />
- Number of centres required <strong>to</strong> service<br />
all small areas defined by the model is<br />
excessive resulting in potentially prohibitive<br />
costs.<br />
- Many small areas have small population<br />
sizes. The lower limit population size for<br />
efficient service delivery is not known.<br />
- The implications for lead agency input and<br />
ability <strong>to</strong> leverage off existing services in<br />
very small geographic areas is unknown.<br />
Smaller populations are likely <strong>to</strong><br />
necessitate either smaller sites, with lower<br />
average <strong>headspace</strong> and MBS funding, or<br />
a lower limit on the region size in-scope<br />
for allocation. This information is not<br />
available <strong>to</strong> the evaluation team and<br />
therefore determining robust estimates of<br />
costs with expansion based on this model<br />
is not possible.<br />
Alternative geographic boundaries (UCL)<br />
Assigns centres <strong>to</strong> SA4s (metropolitan) and UCLs<br />
(non-metropolitan) defined by the ASGS. Those<br />
UCLs within 1 hour’s travel time of an existing<br />
centre are considered <strong>to</strong> have access and are<br />
therefore out of scope for a new centre. Allocation<br />
weighted using SEIFA and ARIA<br />
- UCLs are more likely <strong>to</strong> reflect functional<br />
communities, and therefore service catchment<br />
areas, than SA3s in non-metropolitan areas<br />
- Unlikely <strong>to</strong> reflect true access for all <strong>young</strong><br />
people, particularly those in rural and remote<br />
areas<br />
- Model would result in a large number<br />
of sites in regions with small populations.<br />
Again, a lower limit may be required based<br />
on region size.<br />
As above, allocation <strong>to</strong> UCLs includes<br />
areas with very small populations and<br />
will likely require smaller centres or limits<br />
placed on the smallest in-scope region<br />
size. Therefore, costing is not possible<br />
Hub and spoke model<br />
A formalised network in which smaller spoke sites<br />
are supported by the larger hub sites.<br />
- Likely <strong>to</strong> be associated with some cost saving<br />
if smaller spoke sites have lower funding<br />
requirements<br />
- May provide greater access <strong>to</strong> rural and<br />
remote areas whose small populations will not<br />
support a full time <strong>headspace</strong> centre<br />
- Well established model of service delivery<br />
- Very little information within the current<br />
<strong>headspace</strong> model <strong>to</strong> determine impacts on<br />
service delivery, number of sites and costs<br />
- Diverges from the current <strong>headspace</strong> model<br />
- Potential implications for quality and<br />
timeliness of service delivery in spoke sites<br />
- Unknown implications for ability <strong>to</strong> attract<br />
consortia partners<br />
The evaluation team have no information<br />
on which <strong>to</strong> base the costs of smaller<br />
spoke sites. In addition, the lack of<br />
information regarding the efficient and<br />
effective geographic distribution of hub<br />
and spoke sites mean that determining<br />
the number of centres and the cost<br />
implications of this model is not possible.<br />
Social Policy Research Centre 2015<br />
<strong>headspace</strong> Evaluation Final Report<br />
162