Appendix G Youth <strong>headspace</strong> access by funding round and state Table G1 Round 1 (10 centres) – established 2007 State State youth population a Additional coverage Total coverage Youth not covered Percentage not covered New South Wales 1,246,577 141,120 141,120 1,105,457 88.68 Vic<strong>to</strong>ria 993,359 213,783 213,783 779,576 78.48 Queensland 820,217 0 0 820,217 100.00 South Australia 288,762 76,106 76,106 212,656 73.64 Western Australia 428,209 9,263 9,263 418,946 97.84 Tasmania 87,341 0 0 87,341 100.00 Northern Terri<strong>to</strong>ry 44,441 24,652 24,652 19,789 44.53 ACT 73,462 0 0 73,462 100.00 Australia 3,982,368 464,924 464,924 3,517,444 88.33 a population is as at the 2011 Census of Population and Housing. Table G2 Round 2 (20 centres) – established 2009 State State youth population a Additional coverage Total coverage Youth not covered Percentage not covered New South Wales 1,246,577 149,128 290,248 956,329 76.72 Vic<strong>to</strong>ria 993,359 137,602 351,385 641,974 64.63 Queensland 820,217 64,614 64,614 755,603 92.12 South Australia 288,762 11,173 87,279 201,483 69.77 Western Australia 428,209 75,485 84,748 343,461 80.21 Tasmania 87,341 15,840 15,840 71,501 81.86 Northern Terri<strong>to</strong>ry 44,441 7,639 32,291 12,150 27.34 ACT 73,462 73,462 73,462 0 0.00 Australia 3,982,368 534,943 999,867 2,982,501 74.89 a population is as at the 2011 Census of Population and Housing. Social Policy Research Centre 2015 <strong>headspace</strong> Evaluation Final Report 206
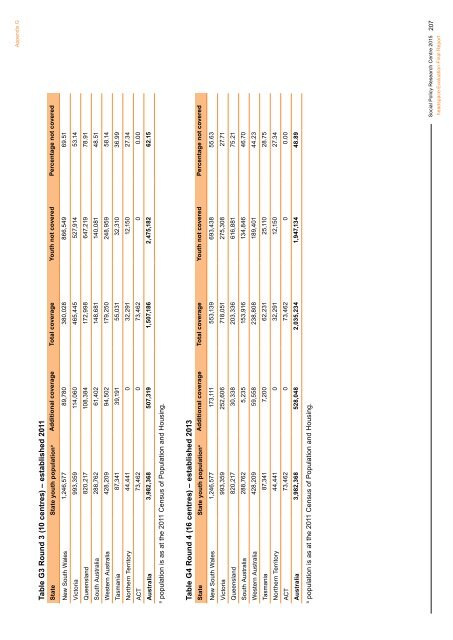
Appendix G Table G3 Round 3 (10 centres) – established 2011 State State youth population a Additional coverage Total coverage Youth not covered Percentage not covered New South Wales 1,246,577 89,780 380,028 866,549 69.51 Vic<strong>to</strong>ria 993,359 114,060 465,445 527,914 53.14 Queensland 820,217 108,384 172,998 647,219 78.91 South Australia 288,762 61,402 148,681 140,081 48.51 Western Australia 428,209 94,502 179,250 248,959 58.14 Tasmania 87,341 39,191 55,031 32,310 36.99 Northern Terri<strong>to</strong>ry 44,441 0 32,291 12,150 27.34 ACT 73,462 0 73,462 0 0.00 Australia 3,982,368 507,319 1,507,186 2,475,182 62.15 a population is as at the 2011 Census of Population and Housing. Table G4 Round 4 (16 centres) – established 2013 State State youth population a Additional coverage Total coverage Youth not covered Percentage not covered New South Wales 1,246,577 173,111 553,139 693,438 55.63 Vic<strong>to</strong>ria 993,359 252,606 718,051 275,308 27.71 Queensland 820,217 30,338 203,336 616,881 75.21 South Australia 288,762 5,235 153,916 134,846 46.70 Western Australia 428,209 59,558 238,808 189,401 44.23 Tasmania 87,341 7,200 62,231 25,110 28.75 Northern Terri<strong>to</strong>ry 44,441 0 32,291 12,150 27.34 ACT 73,462 0 73,462 0 0.00 Australia 3,982,368 528,048 2,035,234 1,947,134 48.89 a population is as at the 2011 Census of Population and Housing. Social Policy Research Centre 2015 <strong>headspace</strong> Evaluation Final Report 207
- Page 1 and 2:
Is headspace making a difference to
- Page 3 and 4:
Authors This report was written by
- Page 5 and 6:
5. Service Delivery Model 73 5.1 Wh
- Page 7 and 8:
Table 6.1 Table 6.2 Table 6.3 Main
- Page 9 and 10:
Figure 4.9 Figure 4.10 Figure 4.11
- Page 11 and 12:
Executive Summary headspace 1 aims
- Page 13 and 14:
Executive Summary or very high leve
- Page 15 and 16:
Executive Summary through mental he
- Page 17 and 18:
value to society of the improvement
- Page 19 and 20:
1. Introduction people in Australia
- Page 21 and 22:
2. Evaluation Methodology 2.1 Aims
- Page 23 and 24:
2. Evaluation Methodology Evaluatio
- Page 25 and 26:
2. Evaluation Methodology Table 2.3
- Page 27 and 28:
2. Evaluation Methodology Represent
- Page 29 and 30:
3. Access and Engagement with Centr
- Page 31 and 32:
3. Access and Engagement with Centr
- Page 33 and 34:
3. Access and Engagement with Centr
- Page 35 and 36:
3. Access and Engagement with Centr
- Page 37 and 38:
3. Access and Engagement with Centr
- Page 39 and 40:
3. Access and Engagement with Centr
- Page 41 and 42:
3. Access and Engagement with Centr
- Page 43 and 44:
3. Access and Engagement with Centr
- Page 45 and 46:
3. Access and Engagement with Centr
- Page 47 and 48:
3. Access and Engagement with Centr
- Page 49 and 50:
3. Access and Engagement with Centr
- Page 51 and 52:
4. Outcomes of headspace Clients Th
- Page 53 and 54:
4. Outcomes of headspace Clients 35
- Page 55 and 56:
4. Outcomes of headspace Clients Ch
- Page 57 and 58:
4. Outcomes of headspace Clients No
- Page 59 and 60:
4. Outcomes of headspace Clients Th
- Page 61 and 62:
4. Outcomes of headspace Clients Fi
- Page 63 and 64:
4. Outcomes of headspace Clients A
- Page 65 and 66:
4. Outcomes of headspace Clients Ta
- Page 67 and 68:
4. Outcomes of headspace Clients nu
- Page 69 and 70:
4. Outcomes of headspace Clients No
- Page 71 and 72:
4. Outcomes of headspace Clients Ta
- Page 73 and 74:
y three percentage points, and 2.1
- Page 75 and 76:
4. Outcomes of headspace Clients So
- Page 77 and 78:
4. Outcomes of headspace Clients I
- Page 79 and 80:
4. Outcomes of headspace Clients in
- Page 81 and 82:
4. Outcomes of headspace Clients Wh
- Page 83 and 84:
5. Service Delivery Model For the a
- Page 85 and 86:
5. Service Delivery Model the provi
- Page 87 and 88:
5. Service Delivery Model headspace
- Page 89 and 90:
5. Service Delivery Model services,
- Page 91 and 92:
5. Service Delivery Model services
- Page 93 and 94:
5. Service Delivery Model Further,
- Page 95 and 96:
5. Service Delivery Model that we
- Page 97 and 98:
5. Service Delivery Model is a cons
- Page 99 and 100:
5. Service Delivery Model connectio
- Page 101 and 102:
5. Service Delivery Model Table 5.2
- Page 103 and 104:
5. Service Delivery Model Table 5.3
- Page 105 and 106:
5. Service Delivery Model I don’t
- Page 107 and 108:
5. Service Delivery Model group is
- Page 109 and 110:
5. Service Delivery Model Figure 5.
- Page 111 and 112:
6. The Costs of headspace One of th
- Page 113 and 114:
6. The Costs of headspace Table 6.1
- Page 115 and 116:
6. The Costs of headspace In-scope
- Page 117 and 118:
6. The Costs of headspace Revenue/
- Page 119 and 120:
6. The Costs of headspace Other gov
- Page 121 and 122:
7. Conclusion The evaluation of hea
- Page 123 and 124:
7. Conclusion treatment); however,
- Page 125 and 126:
7. Conclusion Overall the evaluatio
- Page 127 and 128:
Appendix A Evaluation scope areas h
- Page 129 and 130:
Appendix B The current model of hea
- Page 131 and 132:
Appendix B and each SA3 in non-capi
- Page 133 and 134:
Appendix B chapter 39 . To determin
- Page 135 and 136:
Appendix B While there is an overal
- Page 137 and 138:
Appendix B Figure B3 describes the
- Page 139 and 140:
Appendix B Figure B5 Cost per young
- Page 141 and 142:
Appendix B The concept of access as
- Page 143 and 144:
Appendix B Figure B7 Heard of heads
- Page 145 and 146:
Figure B10 Proportion of headspace
- Page 147 and 148:
Appendix B Table B5 Females 18-25 y
- Page 149 and 150:
Appendix B following section. Figur
- Page 151 and 152:
Appendix B and less access to mains
- Page 153 and 154:
Appendix B Figure B17 Estimated pre
- Page 155 and 156:
Appendix B Figure B18 SA1s within 1
- Page 157 and 158:
Figure B20 Hypothetical allocation
- Page 159 and 160:
Appendix B The current model of cen
- Page 161 and 162:
Appendix B Current centre funding m
- Page 163 and 164:
Appendix B Evaluation of the curren
- Page 165 and 166: Appendix B Level of funding availab
- Page 167 and 168: Appendix B provide a method for ide
- Page 169 and 170: Appendix B centres and Localities i
- Page 171 and 172: Appendix B for greater flexibility
- Page 173 and 174: Appendix B Additional consideration
- Page 175 and 176: Appendix B of achieving more effici
- Page 177 and 178: Appendix B • Used the simulation
- Page 179 and 180: Appendix C information relating to
- Page 181 and 182: Appendix C Regarding gender, in bot
- Page 183 and 184: Appendix C Figure C5 Total number o
- Page 185 and 186: Appendix C Table C1 Information Sum
- Page 187 and 188: Appendix C Data Cleaning and Analys
- Page 189 and 190: Appendix C groups. The age and sex
- Page 191 and 192: Appendix C Figure C8 Demographic ch
- Page 193 and 194: Appendix C The KeySurvey software s
- Page 195 and 196: Appendix C different client groups.
- Page 197 and 198: Appendix D Round State Centre Name
- Page 199 and 200: Appendix E Characteristics HS clien
- Page 201 and 202: Table E4 Cell Sizes for Figure 3.4
- Page 203 and 204: Appendix F Figure F1 Changes in K10
- Page 205 and 206: Appendix F three SEIFA quintiles. A
- Page 207 and 208: Appendix F Occasion of service inte
- Page 209 and 210: Appendix F Table F1 Cell sizes for
- Page 211 and 212: Appendix F Table F4 Cell sizes for
- Page 213 and 214: Appendix F Table F9 Cell sizes for
- Page 215: Appendix G Supplementary material f
- Page 219 and 220: Appendix G Table G7 Round 7 (10 cen
- Page 221 and 222: State (youth population) a headspac
- Page 223 and 224: State (youth population) a headspac
- Page 225 and 226: Appendix G Table G12 Round 11(16 ce
- Page 227 and 228: Table G16 Additional youth populati
- Page 229 and 230: Round Region State Additional youth
- Page 231 and 232: State (youth population) a headspac
- Page 233 and 234: State (youth population) a headspac
- Page 235 and 236: Appendix G Figure G1 Percentage of
- Page 237 and 238: Appendix G Figure G5 Percentage of
- Page 239 and 240: Appendix G Figure G9 Percentage of
- Page 241 and 242: Appendix G Figure G13 Percentage of
- Page 243 and 244: Appendix G Table G22 Australians 18
- Page 245 and 246: Appendix G Synthetic small area est
- Page 247 and 248: Appendix G Figure G16 Estimated pre
- Page 249 and 250: Appendix G Figure G18 Estimated pre
- Page 251 and 252: Appendix G Figure G20 Estimated pre
- Page 253 and 254: Appendix G Figure G22 SA1s within 1
- Page 255 and 256: Appendix G Figure G24 SA1s within 1
- Page 257 and 258: Appendix G Figure G26 SA1s within 1
- Page 259 and 260: Appendix G Table G25 Centres alloca
- Page 261 and 262: References Atkins, D.C., Bedics, J.
- Page 263: References Smith, E., Jones, T., Wa