- Page 1 and 2: Is headspace making a difference to
- Page 3 and 4: Authors This report was written by
- Page 5 and 6: 5. Service Delivery Model 73 5.1 Wh
- Page 7 and 8: Table 6.1 Table 6.2 Table 6.3 Main
- Page 9 and 10: Figure 4.9 Figure 4.10 Figure 4.11
- Page 11 and 12: Executive Summary headspace 1 aims
- Page 13 and 14: Executive Summary or very high leve
- Page 15 and 16: Executive Summary through mental he
- Page 17 and 18: value to society of the improvement
- Page 19 and 20: 1. Introduction people in Australia
- Page 21 and 22: 2. Evaluation Methodology 2.1 Aims
- Page 23 and 24: 2. Evaluation Methodology Evaluatio
- Page 25 and 26: 2. Evaluation Methodology Table 2.3
- Page 27: 2. Evaluation Methodology Represent
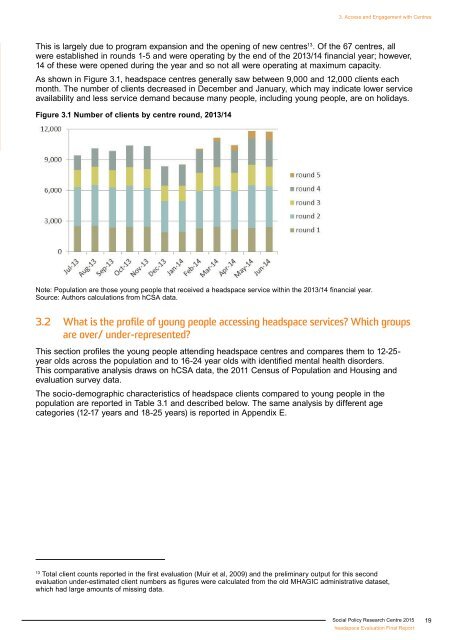
- Page 31 and 32: 3. Access and Engagement with Centr
- Page 33 and 34: 3. Access and Engagement with Centr
- Page 35 and 36: 3. Access and Engagement with Centr
- Page 37 and 38: 3. Access and Engagement with Centr
- Page 39 and 40: 3. Access and Engagement with Centr
- Page 41 and 42: 3. Access and Engagement with Centr
- Page 43 and 44: 3. Access and Engagement with Centr
- Page 45 and 46: 3. Access and Engagement with Centr
- Page 47 and 48: 3. Access and Engagement with Centr
- Page 49 and 50: 3. Access and Engagement with Centr
- Page 51 and 52: 4. Outcomes of headspace Clients Th
- Page 53 and 54: 4. Outcomes of headspace Clients 35
- Page 55 and 56: 4. Outcomes of headspace Clients Ch
- Page 57 and 58: 4. Outcomes of headspace Clients No
- Page 59 and 60: 4. Outcomes of headspace Clients Th
- Page 61 and 62: 4. Outcomes of headspace Clients Fi
- Page 63 and 64: 4. Outcomes of headspace Clients A
- Page 65 and 66: 4. Outcomes of headspace Clients Ta
- Page 67 and 68: 4. Outcomes of headspace Clients nu
- Page 69 and 70: 4. Outcomes of headspace Clients No
- Page 71 and 72: 4. Outcomes of headspace Clients Ta
- Page 73 and 74: y three percentage points, and 2.1
- Page 75 and 76: 4. Outcomes of headspace Clients So
- Page 77 and 78: 4. Outcomes of headspace Clients I
- Page 79 and 80:
4. Outcomes of headspace Clients in
- Page 81 and 82:
4. Outcomes of headspace Clients Wh
- Page 83 and 84:
5. Service Delivery Model For the a
- Page 85 and 86:
5. Service Delivery Model the provi
- Page 87 and 88:
5. Service Delivery Model headspace
- Page 89 and 90:
5. Service Delivery Model services,
- Page 91 and 92:
5. Service Delivery Model services
- Page 93 and 94:
5. Service Delivery Model Further,
- Page 95 and 96:
5. Service Delivery Model that we
- Page 97 and 98:
5. Service Delivery Model is a cons
- Page 99 and 100:
5. Service Delivery Model connectio
- Page 101 and 102:
5. Service Delivery Model Table 5.2
- Page 103 and 104:
5. Service Delivery Model Table 5.3
- Page 105 and 106:
5. Service Delivery Model I don’t
- Page 107 and 108:
5. Service Delivery Model group is
- Page 109 and 110:
5. Service Delivery Model Figure 5.
- Page 111 and 112:
6. The Costs of headspace One of th
- Page 113 and 114:
6. The Costs of headspace Table 6.1
- Page 115 and 116:
6. The Costs of headspace In-scope
- Page 117 and 118:
6. The Costs of headspace Revenue/
- Page 119 and 120:
6. The Costs of headspace Other gov
- Page 121 and 122:
7. Conclusion The evaluation of hea
- Page 123 and 124:
7. Conclusion treatment); however,
- Page 125 and 126:
7. Conclusion Overall the evaluatio
- Page 127 and 128:
Appendix A Evaluation scope areas h
- Page 129 and 130:
Appendix B The current model of hea
- Page 131 and 132:
Appendix B and each SA3 in non-capi
- Page 133 and 134:
Appendix B chapter 39 . To determin
- Page 135 and 136:
Appendix B While there is an overal
- Page 137 and 138:
Appendix B Figure B3 describes the
- Page 139 and 140:
Appendix B Figure B5 Cost per young
- Page 141 and 142:
Appendix B The concept of access as
- Page 143 and 144:
Appendix B Figure B7 Heard of heads
- Page 145 and 146:
Figure B10 Proportion of headspace
- Page 147 and 148:
Appendix B Table B5 Females 18-25 y
- Page 149 and 150:
Appendix B following section. Figur
- Page 151 and 152:
Appendix B and less access to mains
- Page 153 and 154:
Appendix B Figure B17 Estimated pre
- Page 155 and 156:
Appendix B Figure B18 SA1s within 1
- Page 157 and 158:
Figure B20 Hypothetical allocation
- Page 159 and 160:
Appendix B The current model of cen
- Page 161 and 162:
Appendix B Current centre funding m
- Page 163 and 164:
Appendix B Evaluation of the curren
- Page 165 and 166:
Appendix B Level of funding availab
- Page 167 and 168:
Appendix B provide a method for ide
- Page 169 and 170:
Appendix B centres and Localities i
- Page 171 and 172:
Appendix B for greater flexibility
- Page 173 and 174:
Appendix B Additional consideration
- Page 175 and 176:
Appendix B of achieving more effici
- Page 177 and 178:
Appendix B • Used the simulation
- Page 179 and 180:
Appendix C information relating to
- Page 181 and 182:
Appendix C Regarding gender, in bot
- Page 183 and 184:
Appendix C Figure C5 Total number o
- Page 185 and 186:
Appendix C Table C1 Information Sum
- Page 187 and 188:
Appendix C Data Cleaning and Analys
- Page 189 and 190:
Appendix C groups. The age and sex
- Page 191 and 192:
Appendix C Figure C8 Demographic ch
- Page 193 and 194:
Appendix C The KeySurvey software s
- Page 195 and 196:
Appendix C different client groups.
- Page 197 and 198:
Appendix D Round State Centre Name
- Page 199 and 200:
Appendix E Characteristics HS clien
- Page 201 and 202:
Table E4 Cell Sizes for Figure 3.4
- Page 203 and 204:
Appendix F Figure F1 Changes in K10
- Page 205 and 206:
Appendix F three SEIFA quintiles. A
- Page 207 and 208:
Appendix F Occasion of service inte
- Page 209 and 210:
Appendix F Table F1 Cell sizes for
- Page 211 and 212:
Appendix F Table F4 Cell sizes for
- Page 213 and 214:
Appendix F Table F9 Cell sizes for
- Page 215 and 216:
Appendix G Supplementary material f
- Page 217 and 218:
Appendix G Table G3 Round 3 (10 cen
- Page 219 and 220:
Appendix G Table G7 Round 7 (10 cen
- Page 221 and 222:
State (youth population) a headspac
- Page 223 and 224:
State (youth population) a headspac
- Page 225 and 226:
Appendix G Table G12 Round 11(16 ce
- Page 227 and 228:
Table G16 Additional youth populati
- Page 229 and 230:
Round Region State Additional youth
- Page 231 and 232:
State (youth population) a headspac
- Page 233 and 234:
State (youth population) a headspac
- Page 235 and 236:
Appendix G Figure G1 Percentage of
- Page 237 and 238:
Appendix G Figure G5 Percentage of
- Page 239 and 240:
Appendix G Figure G9 Percentage of
- Page 241 and 242:
Appendix G Figure G13 Percentage of
- Page 243 and 244:
Appendix G Table G22 Australians 18
- Page 245 and 246:
Appendix G Synthetic small area est
- Page 247 and 248:
Appendix G Figure G16 Estimated pre
- Page 249 and 250:
Appendix G Figure G18 Estimated pre
- Page 251 and 252:
Appendix G Figure G20 Estimated pre
- Page 253 and 254:
Appendix G Figure G22 SA1s within 1
- Page 255 and 256:
Appendix G Figure G24 SA1s within 1
- Page 257 and 258:
Appendix G Figure G26 SA1s within 1
- Page 259 and 260:
Appendix G Table G25 Centres alloca
- Page 261 and 262:
References Atkins, D.C., Bedics, J.
- Page 263:
References Smith, E., Jones, T., Wa