

Is headspace making a difference to young people’s lives?
Evaluation-of-headspace-program
Evaluation-of-headspace-program

You also want an ePaper? Increase the reach of your titles
YUMPU automatically turns print PDFs into web optimized ePapers that Google loves.
Appendix B<br />
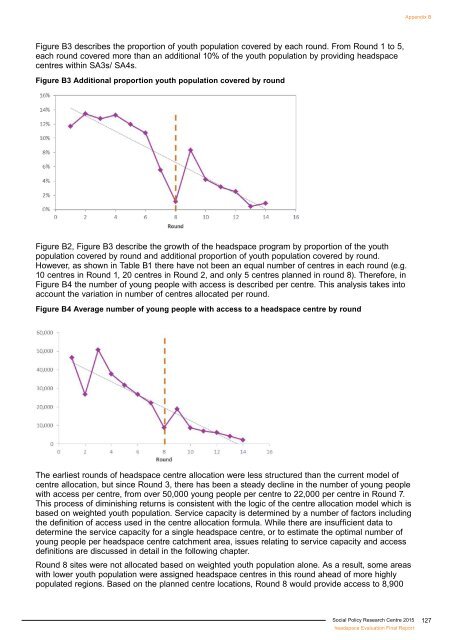
Figure B3 describes the proportion of youth population covered by each round. From Round 1 <strong>to</strong> 5,<br />
each round covered more than an additional 10% of the youth population by providing <strong>headspace</strong><br />
centres within SA3s/ SA4s.<br />
Figure B3 Additional proportion youth population covered by round<br />
Figure B2, Figure B3 describe the growth of the <strong>headspace</strong> program by proportion of the youth<br />
population covered by round and additional proportion of youth population covered by round.<br />
However, as shown in Table B1 there have not been an equal number of centres in each round (e.g.<br />
10 centres in Round 1, 20 centres in Round 2, and only 5 centres planned in round 8). Therefore, in<br />
Figure B4 the number of <strong>young</strong> people with access is described per centre. This analysis takes in<strong>to</strong><br />
account the variation in number of centres allocated per round.<br />
Figure B4 Average number of <strong>young</strong> people with access <strong>to</strong> a <strong>headspace</strong> centre by round<br />
The earliest rounds of <strong>headspace</strong> centre allocation were less structured than the current model of<br />
centre allocation, but since Round 3, there has been a steady decline in the number of <strong>young</strong> people<br />
with access per centre, from over 50,000 <strong>young</strong> people per centre <strong>to</strong> 22,000 per centre in Round 7.<br />
This process of diminishing returns is consistent with the logic of the centre allocation model which is<br />
based on weighted youth population. Service capacity is determined by a number of fac<strong>to</strong>rs including<br />
the definition of access used in the centre allocation formula. While there are insufficient data <strong>to</strong><br />
determine the service capacity for a single <strong>headspace</strong> centre, or <strong>to</strong> estimate the optimal number of<br />
<strong>young</strong> people per <strong>headspace</strong> centre catchment area, issues relating <strong>to</strong> service capacity and access<br />
definitions are discussed in detail in the following chapter.<br />
Round 8 sites were not allocated based on weighted youth population alone. As a result, some areas<br />
with lower youth population were assigned <strong>headspace</strong> centres in this round ahead of more highly<br />
populated regions. Based on the planned centre locations, Round 8 would provide access <strong>to</strong> 8,900<br />
Social Policy Research Centre 2015<br />
<strong>headspace</strong> Evaluation Final Report<br />
127