

CORRUPTION IN CONFLICT
5IlaWjQej
5IlaWjQej

Create successful ePaper yourself
Turn your PDF publications into a flip-book with our unique Google optimized e-Paper software.
BOX 2: ABSORPTIVE CAPACITY<br />
In the development community, the concept of “absorptive capacity” generally<br />
refers to the “amount and form of international aid and attention that recipient<br />
institutions and societies can receive without suffering significant social,<br />
economic, or political disruptions.” 330 In other words, “absorptive capacity sets<br />
limits on the productive potential of aid.” 331 Scholar Robert Lamb describes a<br />
useful metaphor for understanding the concept:<br />
Place a dry sponge on a dry table and pour water onto the sponge<br />
from a pitcher. Pour too much water and the table gets wet after<br />
the sponge reaches capacity; pour too little water and the sponge<br />
does not consume as much water as it could; pour too quickly and<br />
the table gets wet even before the sponge reaches capacity. Some<br />
sponges absorb more water than others; a dry sponge absorbs<br />
water less quickly than does a damp sponge. Most sponges get<br />
larger as they absorb the water. All have limits to the quantity and<br />
rate of absorption. 332<br />
Afghanistan’s ability to absorb and effectively use assistance funds has been<br />
a significant concern in the debate over the scale and rate of reconstruction<br />
assistance. 333 In Afghanistan, spillover from more than $100 billion in<br />
reconstruction assistance contributed to pervasive corruption, illicit activity, and<br />
other adverse effects that distorted economic norms and undermined state<br />
legitimacy. 334 Integrity Watch Afghanistan founder and former director Lorenzo<br />
Delesgues stressed that “staying within absorption limits is Development 101.” 335<br />
120%<br />
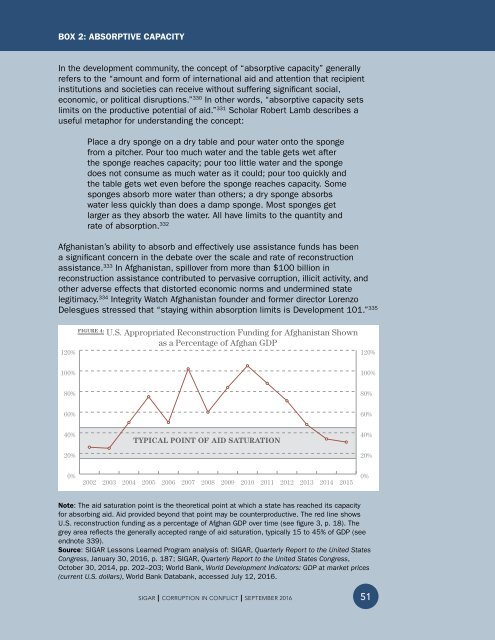
FIGURE 4:<br />
U.S. Appropriated Reconstruction Funding for Afghanistan Shown<br />
as a Percentage of Afghan GDP<br />
120%<br />
100%<br />
100%<br />
80%<br />
80%<br />
60%<br />
60%<br />
40%<br />
20%<br />
TYPICAL PO<strong>IN</strong>T OF AID SATURATION<br />
40%<br />
20%<br />
0%<br />
2002<br />
2003<br />
2004<br />
2005<br />
2006<br />
2007<br />
2008<br />
2009<br />
2010<br />
2011<br />
2012<br />
2013<br />
2014<br />
2015<br />
0%<br />
Note: The aid saturation point is the theoretical point at which a state has reached its capacity<br />
for absorbing aid. Aid provided beyond that point may be counterproductive. The red line shows<br />
U.S. reconstruction funding as a percentage of Afghan GDP over time (see figure 3, p. 18). The<br />
grey area reflects the generally accepted range of aid saturation, typically 15 to 45% of GDP (see<br />
endnote 339).<br />
Source: SIGAR Lessons Learned Program analysis of: SIGAR, Quarterly Report to the United States<br />
Congress, January 30, 2016, p. 187; SIGAR, Quarterly Report to the United States Congress,<br />
October 30, 2014, pp. 202–203; World Bank, World Development Indicators: GDP at market prices<br />
(current U.S. dollars), World Bank Databank, accessed July 12, 2016.<br />
SIGAR I <strong>CORRUPTION</strong> <strong>IN</strong> <strong>IN</strong> <strong>CONFLICT</strong> I I SEPTEMBER 2016 2016<br />
51